


Dollar, USDCNH, S&P 500 Talking Points:
- Risk appetite charged higher as measured by the S& 500, but both the top-performing tech shares and broader risk measures (like carry and EEM) flagged this past session
- A Dollar rally awakens a dormant charge for bulls, but until the likes of the EURUSD breaks 1.1700 support, I still see it as a ‘range check’
- The ADP private payrolls figures were half the forecast which bodes poorly for Friday NFPs, but seasonal liquidity is my top concern moving forward
While Equity Indices Find Some Agreement, Apple and Other Assets Struggle
Finally, there was some alignment between my preferred measure of rampant speculation (the S&P 500) and the other major indices across the globe. Perhaps some agreement from the most heavily trafficked asset class in the world is the sign long sought that conviction is being restored behind the FOMO-driven risk appetite of the past months? I would contest that notion – or at least hold serious doubts until we cross some more significant bridges. From this past session, there was definitely some evidence of risk appetite. Both the S&P 500 and Nasdaq pushed to fresh record high closes. Prior to that the DAX, FTSE 100 and Nikkei 225 all advanced on their own. That is more agreement than we have seen for some time. And yet, it doesn’t account for the asymmetry in other asset classes nor stir the kind of deep intent so desperately missing from the financial system over these past weeks during the ‘summer doldrums’.
Learn more about the three types of general Forex market analysis in our education section.
Chart of S&P 500 with 20-Day Moving Average and 1-Day Rate of Change (Daily)
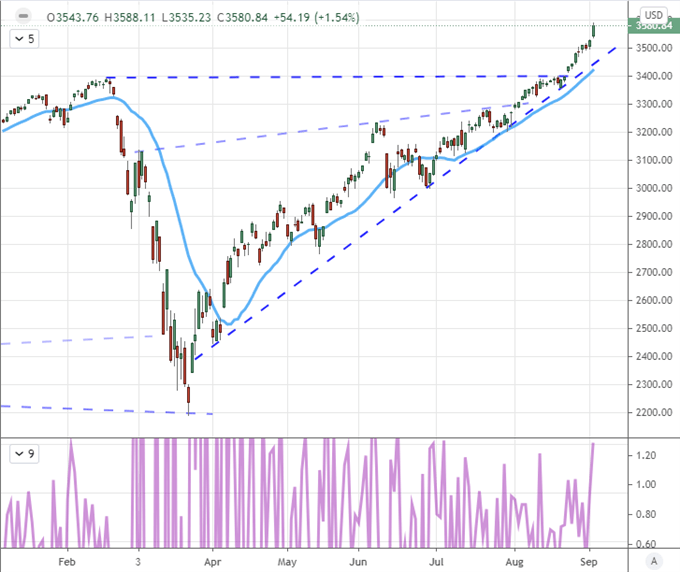
Chart Created on Tradingview Platform
While there are many cracks in the suggestion that speculative appetite is carving a broad path of recovery, it is worth noting that there is discrepancy at both the top and bottom end of the sentiment spectrum. In contrast to the US stock market’s day, there was still a struggle registered for the likes of emerging market assets, Treasury yields (with a growth sensitivity), crude oil which suffered a technical breakdown and carry trade among others. This is not exactly out of ordinary given recent conditions. Far more interesting in my book was the slip from some of the darlings of the tech crowd. While the Nasdaq carved a dramatic daily candle with a massive tail, both Apple and Tesla suffered significant stumbles. These have been the symbolic leaders for the Robinhood crowd looking to ride the wave and the professional sharks looking to take advantage of the momentum.
Chart of Apple with 20-Day Moving Average Overlaid with Nasdaq 100 (Daily)
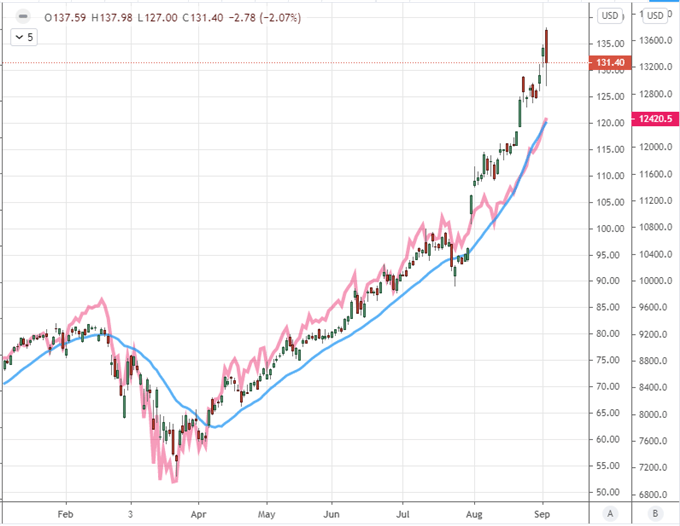
Chart Created on Tradingview Platform
Seasonality is Still A Leading Market Contend but Mind the Fundamentals
As the benchmarks of market intent continue to contradict a clear message, I am keeping my sights on the motivations that can take up the banner as a common driver for the speculative rank – whether it takes a bearish or bullish course. There are some noteworthy technical measures in important areas and the systemic matters on the fundamental side are a tinderbox, but my top concern remains market conditions. Amid the recent volatility, liquidity and volume remain noticeably restricted. We are moving into what is the historically the most active month of the year, but the period before the US Labor Day holiday and even week of is typically reserved. Unless there is a strong, correlated move across the financial system with a clear driver leading the way (whether as a genuine charge or simple justification), I will maintain expectations of resorting to range and congestion.

Chart of S&P 500 and VIX Seasonal Performance (Monthly)
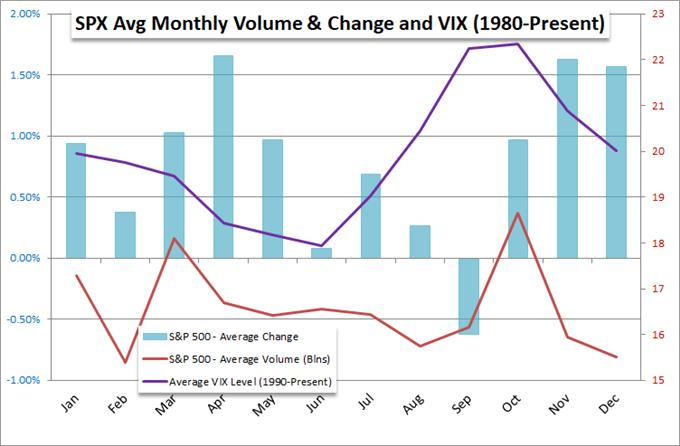
Chart Created by John Kicklighter with Data from Bloomberg
In the next 48 hours of the week, there are a few fundamental themes that can rise from the depths. Trade wars is a constant threat and the pandemic issues are ready to exert weight on the loose hope of a ‘V-shaped’ recovery. Yet, for the time being, direct economic tempo is in my sights. Later today, the US will see its service sector activity report from the ISM which represents approximately three quarters of output from the world’s largest economy. There is considerable influence there. Then we come to Friday’s August NFPs – a more uncertain prospect after the ADP private payrolls printed at half the forecast (438,000) this past session.
Chart of S&P 500 with Manufacturing and Services ISM Surveys (Monthly)
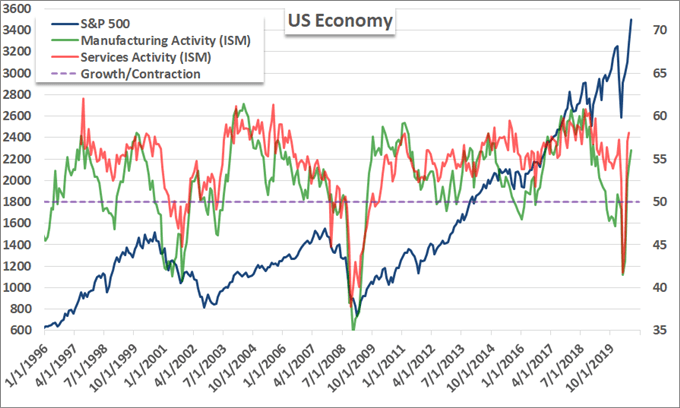
Chart Created by John Kicklighter
The Dollar Has Attempted to Halt Its Tumble and I’m Watching USDCNH for Next Moves
Until recently, the SPX and Nasdaq have been the outliers for significant market activity; but the US Dollar continues to impress with its own volatility lately. With the Greenback on the verge of breaking another long-term technical support (92 on the DXY Index), the currency held the line Tuesday and actually rallied this past session. That has left an impressive reversal on key pairings like EURUSD with a dramatic tail at 1.2000. For those that are long simmering USD bulls, this looks like the start of the trend reversal they were long awaiting. That is possible, but I am approaching it with far more reticence. While we are turning off the Dollar’s lows, the broader market is still biased towards congestion. If the benchmark exchange rate progresses through 1.1800 (channel low) and then through 1.1700 past 6 week congestion floor, I will be more impressed. Until then, I side with market conditions.

Chart of EURUSD with 50-Day Moving Average and COT Speculative Positioning (Daily)
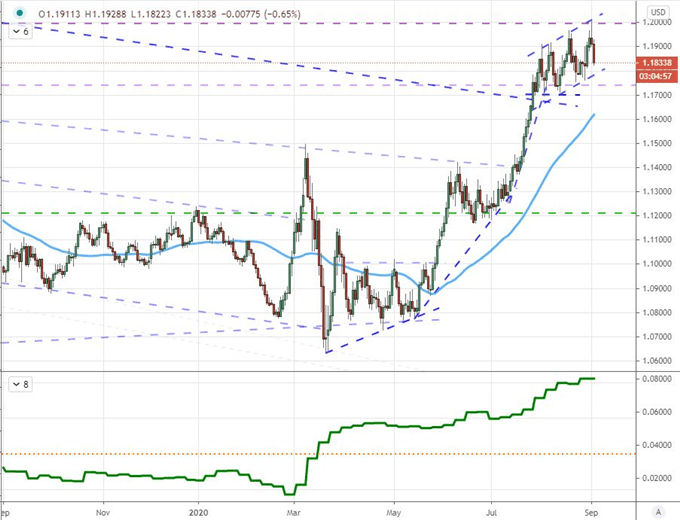
Chart Created on Tradingview Platform
While there are some noteworthy technical barriers from the likes of EURUSD, AUDUSD and GBPUSD; the fundamental measures implications leave something to be desired. My issue is not that there is nothing of material for them to respond to, but rather that the issues are not systemically influential enough to override the hurdles erected in complacency. USDCNH is different. This is not what I would consider a simple market-derived pair but rather a confluence of competing fundamental themes. The rise above 7.00 was indicative of Chinese authorities allowing the Yuan’s depreciation – at risk of being labeled a currency manipulator – to offset the onerous tariffs the US was adding. Now, allowing the Yuan to appreciate looks like a proactive statement to suggest that the Chinese economy is recovering faster than its US counterpart, a call to international investors. Will it work? How far will they allow this message to stretch? I will watch this pair to see.
Chart of USDCNH with 20-Day Moving Average, Consecutive Candles and 20-Day ROC (Daily)
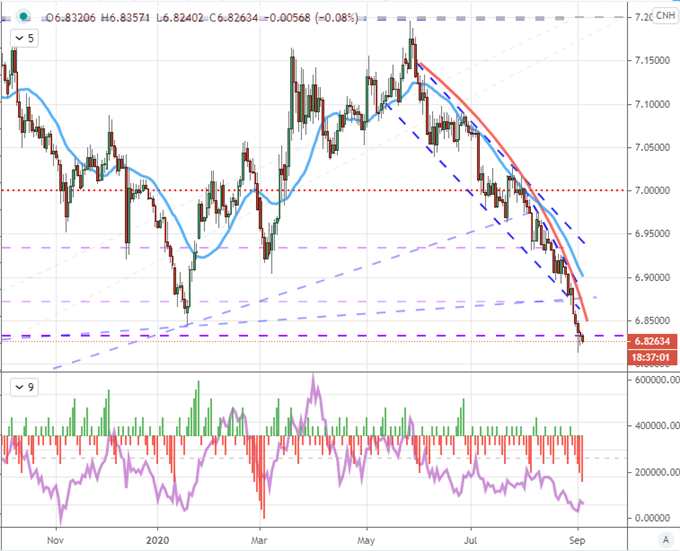
Chart Created on Tradingview Platform

If you want to download my Manic-Crisis calendar, you can find the updated file here.
.


