


Nasdaq 100, Dow, EURUD, GBPUSD Talking Points:
- China seemed to pull the plug on the run-away Shanghai Composite climb to end this past week but the Nasdaq – and key stocks like Tesla and Netflix – continued to surge
- More systemic measures of risk trends like the Dow and S&P 500 will face the coronavirus uncertainties with recession fears and trade war fallout for conviction
- Key event risk ahead ranges from US earnings to China and UK GDP to rate decisions from the ECB, BOJ and BOE among other key events
The Speculative Lead from US Tech Re-Established After China Throws the Breaks
This past week, the lead among risk appetite benchmarks was clear. The Chinese equity markets surged higher backed by an indirect guarantee issued by the government supporting local capital markets. After a 17 percent Shanghai Composite rally in 8 days, however, the Chinese government seemed to recognize the reckless pace and tack steps to throttle a run that had some of the hallmarks of a bubble. We closed out this past week with a notable drop from the Chinese benchmark – the biggest since the March tumble. If you are a global market bull, you’ll seemingly need to find your conviction elsewhere.
Chart of China’s Shanghai Composite Index with 50 and 200-Day Moving Average (Daily Chart)
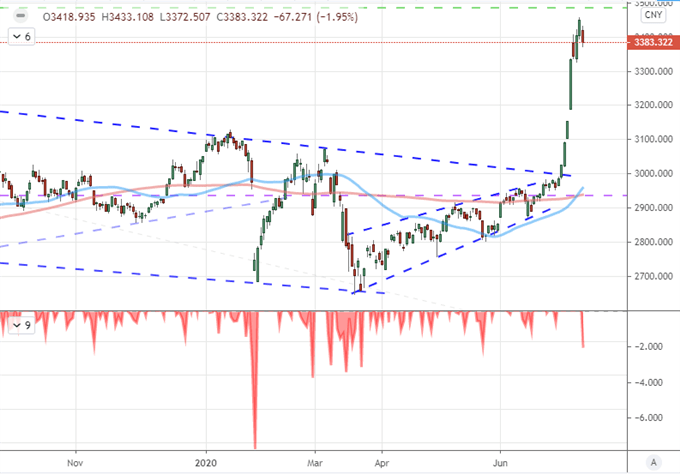
Chart Created on Tradingview Platform
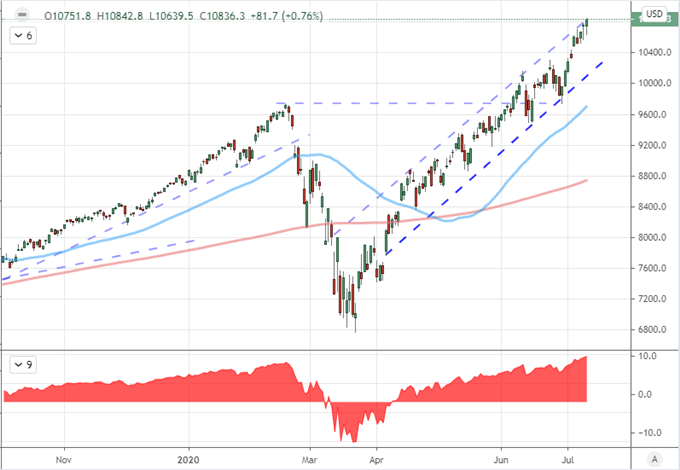
While Chinese policy officials recognized the pressure building in their local markets and responded, it seems there is neither the will nor the means to curb the charge in US tech sector equities. The Nasdaq 100 closed out this past week charging record highs. It is no surprise that some of the key catalysts of this category, therefore, were pressing record highs of their own. Tesla was a big talking point as headlines fixated on inventor Elon Musk’s net worth while Amazon similarly shared top headlines pace for similar reasons. I felt the most remarkable move was the charge from Neflix (NFLX) not because of the intensity of the move but rather because this particular FAANG member is looking forward to an earnings update next week. Beware reality.

Chart of Nasdaq 100 Index with 200 and 50-Day Moving Averages and Spot-200SMA Diff (Daily)
While there remains a clear speculative advantage for those benchmarks with a tech bent, there is a conspicuous lack of lift for some of the more stalwart measures of risk appetite. Most notable in my book are the more recognizable US indices like the Dow Jones Industrial Average and the S&P 500. The latter is the more heavily ‘traded’ index via derivatives (eminis, SPY ETF and VIX) but the I would register far more confidence in systemic risk trends if the blue-chip index were to commit to a clear drive. As it stands the Dow is waffling between it 200 and 5-day moving averages as they progressively converge. In other words, a technical breakout seems inevitable.
Chart of the Dow Jones Industrial Average with 200-Day and 50-Day Moving Averages (Daily Chart)
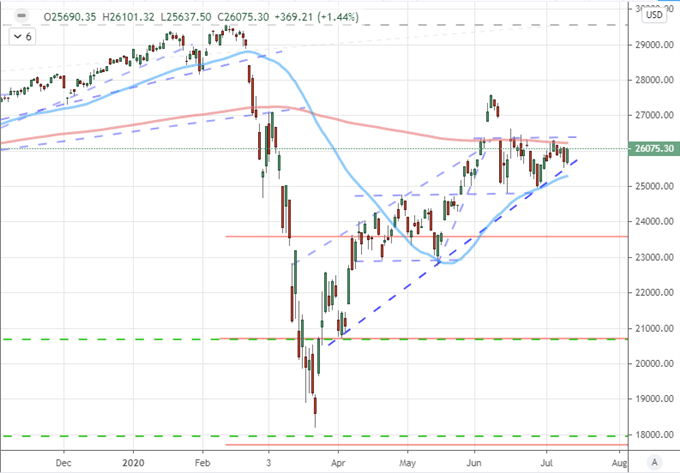
Chart Created on Tradingview Platform
The Top Scheduled Event Risk and Systemic Concerns Ahead
Looking out to the trading week ahead of us, we are facing both systemic and discreet fundamental themes that could reasonable stir volatility ad perhaps even coax out some true trends. From the economic docket, I posed to the social media sphere what they expected to be the top event risk through the next five trading days. Given its spread over the period, the anticipation of US 2Q earnings was unsurprisingly the clear majority vote. While the first week of a US earnings run is heavily weighted to banks, the top of my watch list is actually Netflix on Thursday (after the close).
Poll of the Top Market Moving Event Risk Next Week
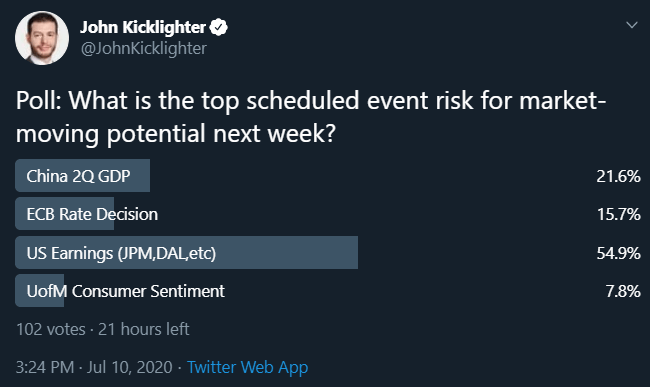
Poll from Twitter.com, @JohnKicklighter Handle
From the traditional data side, however, I would put more emphasis on the Chinese 2Q GDP release. There is actually a run of data from the world’s second largest economy, but this is the most prominent of the wave. Yet, whether quarterly GDP or industrial production or retail sales; the interpretation of China’s economic docket remains the same: deep skepticism as to the accuracy of the figures. Historically, this series rarely strays from a 0.2 percentage point gap relative to official forecasts. Skeptics would say there is manipulation here, but practically speaking, it means that market reaction will be curbed unless this is somehow a material (over +/- 0.2 ppt) difference from the consensus. Nevertheless, USDCNH and the Shanghai Composite are on my radar.
Chart of USDCNH with 200-Day and 50-Day Moving Aveages (Daily)
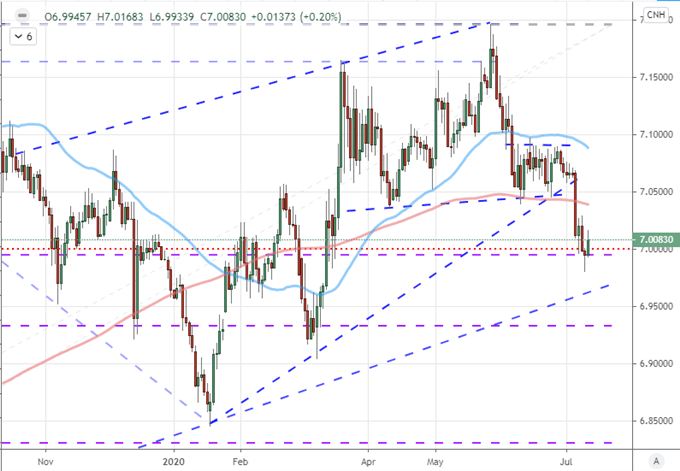
Chart Created on Tradingview Platform
For loaded scheduled event risk, I will put more stock into the UK GDP update on Tuesday. This isn’t as comprehensive as the quarterly report from the world’s second largest economy; but the May figure for Europe’s second largest member is a timely read on the heavily speculative recovery pace from Covid. With a meaningful deviation from forecasts, there may be enough lift here to charge a GBPUSD or GBPAUD breakout.
| Change in | Longs | Shorts | OI |
| Daily | 0% | -6% | -2% |
| Weekly | -14% | 25% | -1% |
Chart of GBPUSD with 200-Day Moving Average (Daily)
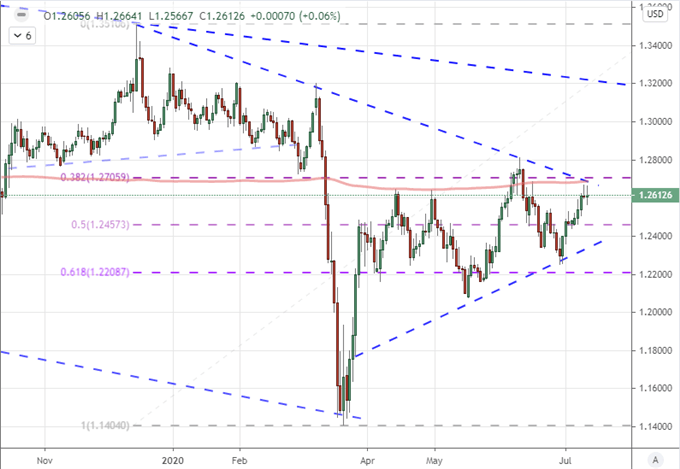
Chart Created on Tradingview Platform
From data to systemic terms, there are some open-ended matter to deal with. In addition to earnings, I will also be watching the coronavirus speculation. On the optimistic side, there remains unspoken hope that the likes of Gilead, Moderna or Novavax will create a vaccine which will head off the economic pain of a second shutdown. Meanwhile, stimulus is taking on a greater burden to keep the peace which means the ECB, BOJ and BOC rate decisions ahead will be expected to do more. Further, the pressure of economic and financial strain is pushing governments to find controversial solutions to local pains. Friday evening, the US announced a deferred 25% tax on a range $1.3 billion in imported French good in response to digital taxes. Clearly, EURUSD should be a close monitor next week.
| Change in | Longs | Shorts | OI |
| Daily | -7% | -7% | -7% |
| Weekly | -23% | 30% | -4% |
Chart of EURUSD with 200-Day Moving Average (Monthly)
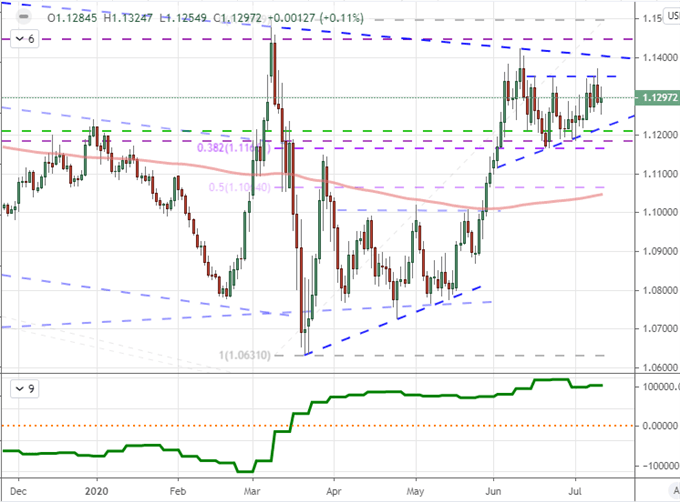
Chart Created on Tradingview Platform

If you want to download my Manic-Crisis calendar, you can find the updated file here.
.


