


Dollar, Gold, Nasdaq, S&P 500 Points:
- Risk trends were spinning their tires to start the new trading week, but there remains a notable charge behind a record setting Nasdaq and FAANG close
- The Dollar’s breakout through the end of last week lost all of its traction with a sharp drop for the DXY Monday that capped potential for EURUSD and AUDUSD reversals
- While unpredictable fundamental threats are always possible, the top scheduled theme over the next 24 hours is recession pacing with global (developed world) June PMIs on tap
Risk Trends Fail to Catch Traction after Friday’s Warning, US-China Trade ‘Misunderstanding’
For those that took note: we ended this past week with a worrying signal. While the cash S&P 500 index closed modestly lower, the popular Emini futures tumbled after the official market close to set expectations on seriously unstable ground. Those fears would not develop further over the weekend however. Through Monday’s open, there was a very modest gap; while active trade found a bid that would better be described as further developing a week-long range rather than mounting a genuine recovery. Between the competing themes of fears over a second wave of the pandemic and blind hope for stimulus, it is no surprise that there remains indecision.
| Change in | Longs | Shorts | OI |
| Daily | -18% | 18% | 7% |
| Weekly | -19% | 14% | 4% |
Chart of the Nasdaq Composite Overlaid with FAANG Index (Daily Chart)
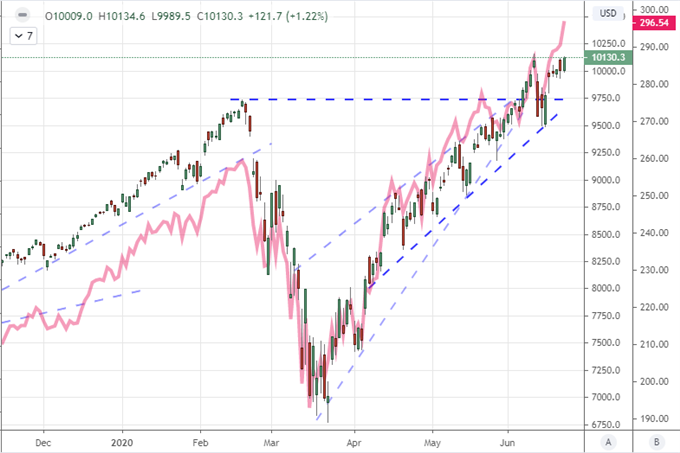
Chart Created on Tradingview Platform
In chart terms, the lack of clarity through this week’s opening session would lead to a fifth consecutive range for the likes of the S&P 500. However, speculative appetite has not been truly chastened. While the broad and ubiquitous measures have not committed to ‘risk on’ or ‘risk off’, there remains an undercurrent of reach. Point-in-case, the Nasdaq 100 managed a record high close – though not intraday high – Monday. Even more impressive was the favorite FAANG group which extended the charge with little hesitation. Monday evening, that isolated confidence was threatened by remarks made by White House trade advisor Peter Navarro who said the United States’ trade deal with China was “over”. Those remarks sent risk assets tumbling and USDCNH rallying. Yet, the White House was not willing to stand by those remarks. A quick U-turn by the adviser and even remarks by President Trump that the trade deal was in place calmed the panic. But was this an earnest misunderstanding or perhaps it was a strategy?
Chart of the USDCNH with 20-Day Moving Average (Daily Chart)
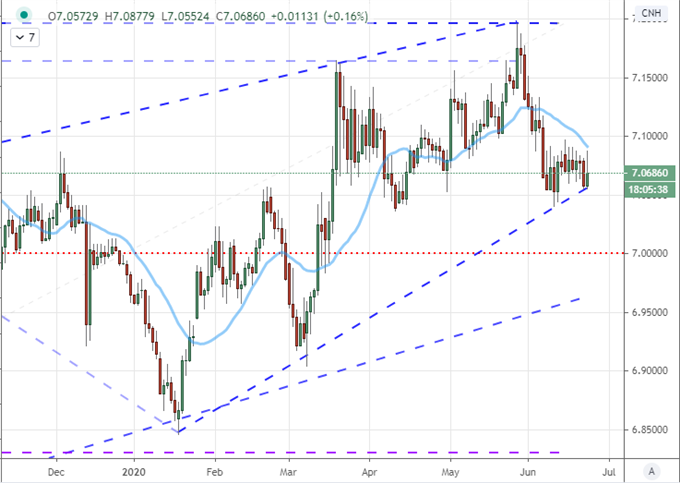
Chart Created on Tradingview Platform
Dollar Breakout Fails, The Nail That Sticks Out the Furthest…
While the undercurrent of sentiment was still struggling for traction, there was still an errant possibility that the US Dollar would step out of step with the many anchored benchmarks and extend the breakout the currency was tempting through Friday’s close. Yet, that bullish run would also hit the skids before it could hit breakout velocity. By Monday morning trade, it seemed that the Greenback was sliding out of scope of its safe-haven designation as risk appetite in bullish leaning markets were struggling. Yet, it is worth noting that the negative correlation between the likes of the DXY and S&P 500 remains remarkably robust through the medium term.
Chart of DXY Dollar Index Overlaid with an Inverted Scale S&P 500 and 6-Period Correlation (4 Hour)
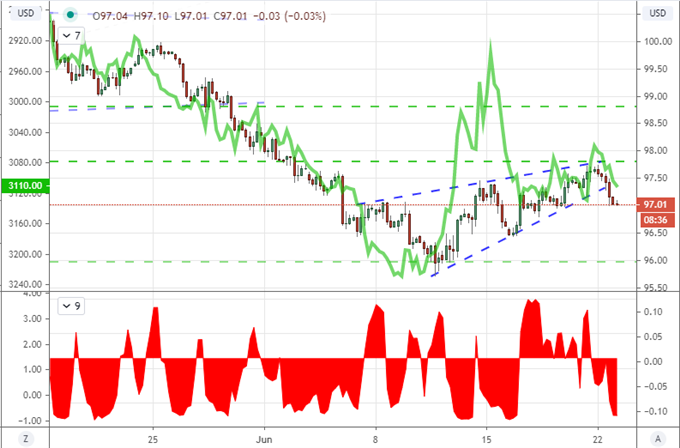
Chart Created on Tradingview Platform
On a higher time frame, the daily chart of the DXY presents a falter just before meaningful resistance could transfer a sense of conviction. Instead, the benchmark took a path of least resistance by breaking support on a rising wedge formation. That well reflects the overbearing influence that speculative sentiment can have in both driving an agenda…or keeping one from developing.
Chart of DXY Dollar Index Overlaid with 1-Day Rate of Change
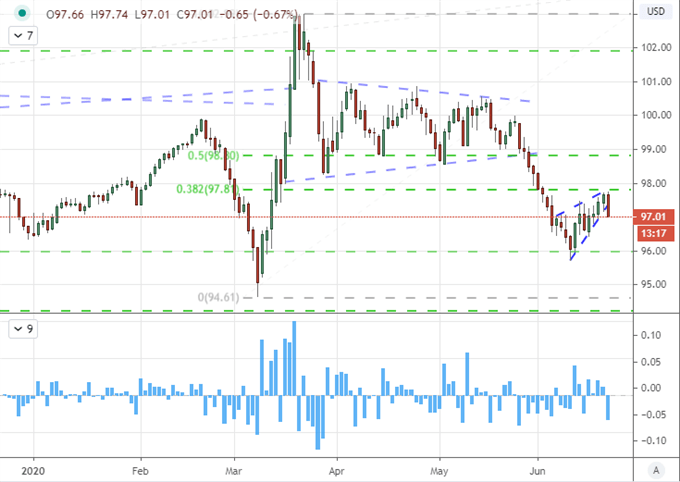
Chart Created by John Kicklighter with Data from Bloomberg
With a range of the Dollar-based majors at the cusp of meaningful technical developments, the lost traction for the benchmark would lead to similarly frustrating show for a range of the crosses. With a substantial technical stance, sensitivity to the risk trends and unmistakable connection to the US-China trade dispute freshly in the headlines, AUDUSD makes for an interesting review. I am keeping a close eye on 0.6800 even if the market has once again held up the support.
| Change in | Longs | Shorts | OI |
| Daily | 2% | 3% | 2% |
| Weekly | 29% | -46% | 0% |
Chart of the Nasdaq Composite Overlaid with FAANG Index (Daily Chart)
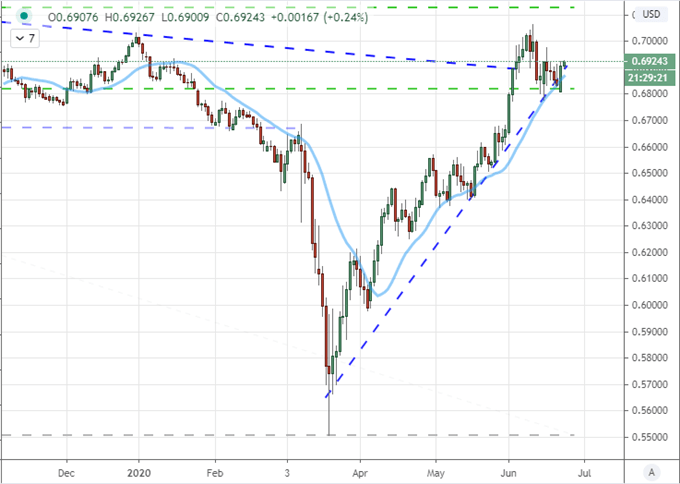
Chart Created on Tradingview Platform
The Pandemic’s Second Wave Against A Focus on Stimulus
While headlines are always open to the unexpected, I maintain close observation of the systemic fundamental themes that have overridden discussion of tertiary matters: the second wave of the pandemic and stimulus. On the former point, global additional cases of confirmed Covid-19 cases hit a record high through Sunday’s tally, adding up to 9 million total on a global basis. With outbreaks reported in China, the US, Germany and Brazil among others; there is a very real threat of economic impact whether officials lockdown their economies again or not – that is unless a vaccine is confirmed and distributed.
Graph of Worldwide Cases of Coronavirus (Daily)
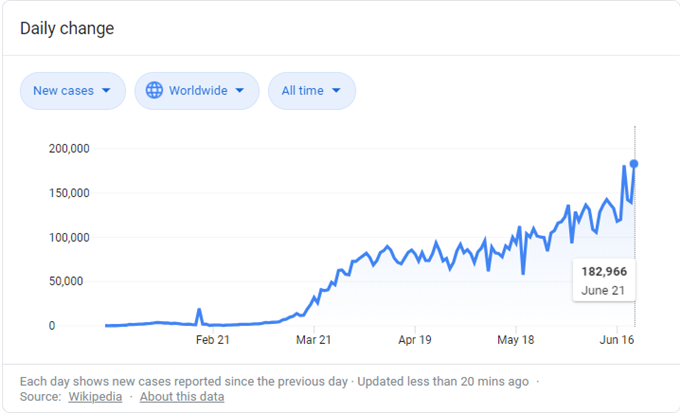
Chart from Google with Data from Wikipedia
Yet, as ominous as the pandemic is, it still finds a strong counterbalance in the hope that surrounds stimulus. The world’s government and major central banks continue to pump support into the system, and investors haven’t missed the infusion. On a recognition basis, the worldwide Google search measure of ‘Stimulus’ has significantly outstripped interest in ‘Growth’.
Chart of Worldwide Google Search Interest in ‘Stimulus’ and ‘Growth’
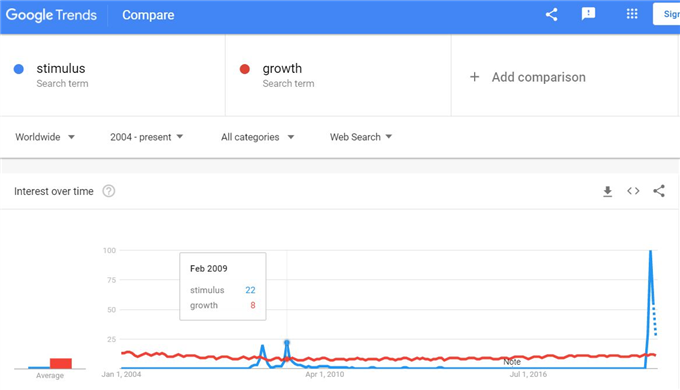
Chart from Google Trends
Speaking of growth, the health of the world’s largest developed world economies is front and center for Tuesday’s session. The problem with official government GDP readings is that they are significantly delayed. That isn’t he problem when it comes to the monthly PMIs from Markit. The flash readings for June are due for Australia, Japan, the Eurozone, the UK and the US through this session. This can be a systemic matter for risk trends or it can be a factor for relative value between divergent readings – so watch the likes of USDJPY, EURGBP and AUDUSD.
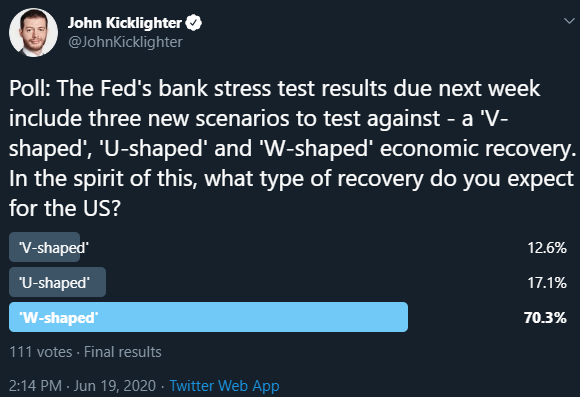
Twitter Poll for the Shape of Recovery in the US Economy (Daily)
Poll from Twitter, @JohnKicklighter

If you want to download my Manic-Crisis calendar, you can find the updated file here.
.


