


Dow, S&P 500, GBPUSD, NZDUSD Talking Points:
- Risk-leaning assets like the S&P 500 and Dow finally presented a day without a gap or strong swing, in fact the 1-day range was one of the smallest since February
- Coronavirus cases are still a prominent fundamental concern while the promise of stimulus is fighting investors critical assessment of the backdrop
- Top event risk over the upcoming session is lead by the Bank of England rate decision, but the influence of the New Zealand GDP, Australian employment and Canadian private payrolls should be watched
When There is Too Much to Keep Track Of
The speculative benchmarks that I keep close track of for my reflection on underlying sentiment trends had noticeably lost traction this past session. Yet, as troubled as price action may have been, the fundamental themes that have driven markets through the past week were still very much in play. The fever dream of stimulus-led speculative appetite was still technically unfolding while the fears over a coronavirus second wave crowded the headlines. Nevertheless, the measures I follow for update on risk trends were disengaged. In fact, the S&P 500 (representing US indices) experienced one of its smallest daily trading ranges since before volatility seized control four months ago.
| Change in | Longs | Shorts | OI |
| Daily | 1% | -1% | 0% |
| Weekly | 15% | -13% | -1% |
Chart of the S&P 500 with 50 and 200-Day Moving Averages and 1-Day ATR (Daily Chart)

Chart Created on Tradingview Platform
While we have clearly taken a break from the exceptional daily gaps and/or charged swings during the active US trade session, that should not lead us to the conclusion that markets have permanently settled. That sense of false assurance seems to permeate the capital markets at present. Aside from the headlines signaling recession and exceptional external support, perhaps the most remarkable story circulating the markets is the rise of the retail trader through all the gloom. The outperformance of Robinhood traders (aptly named) relative to market professionals only further pushes the sense of complacency that we’ve come to expect through the rise of the FAANG and tech shares. Yet the belief of a paradigm shift is more likely the same temporary dislocation fueled by temporary factors (central banks in this case) that we have seen so many times in the past.
Chart of Nasdaq 100 to Dow Ratio Overlaid with FAANG Index (Daily)
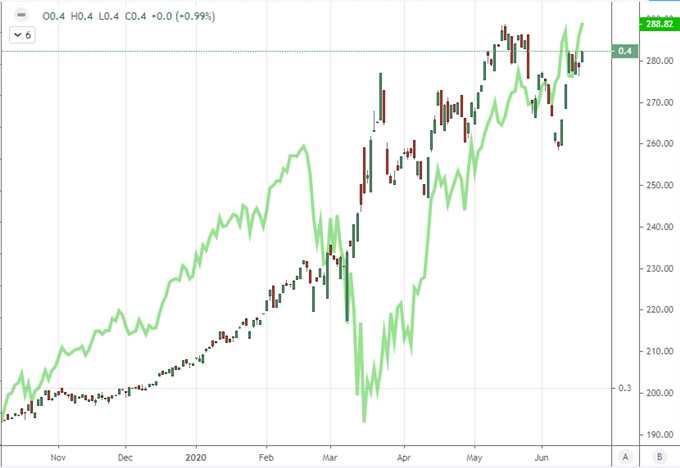
Chart Created on Tradingview Platform
The Temporary and the Permanent
For those that have been paying attention, the world’s largest central banks have taken out nearly all of the stops to encourage confidence. Rates have been pushed to essentially zero – negative in some cases – while stimulus programs have been topped off. While it is still a material disconnect from charging economic growth, such actions have clearly spurred risk appetite. Yet, this is perhaps a destructive drive rather than a virtuous one. The assumption of a backstop from central banks like the Fed, ECB and BOJ creates a ‘moral hazard’ whereby investors believe the risks they would face in investing in a fundamentally ‘expensive’ market has been shifted onto the shoulders of these institutions. That collective delusion could very well hold for a remarkable time, as it certainly has these past years. Then again, is runs the inevitable risk of challenging the abilities of these policy authorities’ ability to keep markets elevated. If confidence in this external force fails, we are facing a serious crisis of confidence.
Chart of the Perceived Effectiveness of Monetary Policy

Chart Created by John Kicklighter
Meanwhile, as the efficacy of central banks to carry capital markets is weighed – or ignored – we still face traditional fundamental degradation in the background. The recession reminders have lightened up somewhat the past session and are not on course for an obvious revival over the coming session. Instead, the principal driver of economic struggle, the pandemic, continues to rise in influence. While news of Beijing’s soft lockdown and an outbreak of COVID cases in Florida’s international airport are prime anecdotal matters, the global search volume at google for ‘second wave’ has his a record high. If this trajectory holds, it would seem almost impossible to avoid the fundamental fallout it represents.
Graph of Global Search Ranking of ‘Second Wave’ (Daily)

Chart from Google Trends
More Targeted Event Risk: BOE and SNB Rate Decisions
While the systemic fundamental issues I keep track of day in and day out are the areas where I believe systemic trends may arise, that doesn’t mean there isn’t potential from key event risk for more concentrated areas of the market. In particular, there are two rate decisions on tap that could be informative given the attention they are drawing and the general scope of dependence on external policy. The Bank of England is top listing Thursday – and perhaps for the week – with anticipation of more stimulus. While there is heavy anticipation for further accommodation like there was for the Brazilian bank’s 75 basis point rate cut this past session, there is still capacity for this effort to call attention to fading efficacy. Perhaps the most pressing reminder of this lost traction is the Swiss National Bank (SNB) who is itself due to weigh its mix today as well. If there were ever a major player that stands as evidence that these authorities cannot effect the changes they intend forever, it would be this group. As such, traders would do well to watch the likes of EURGBP and EURCHF Thursday.
Chart of EURGBP with 200-Day Moving Average (Daily)
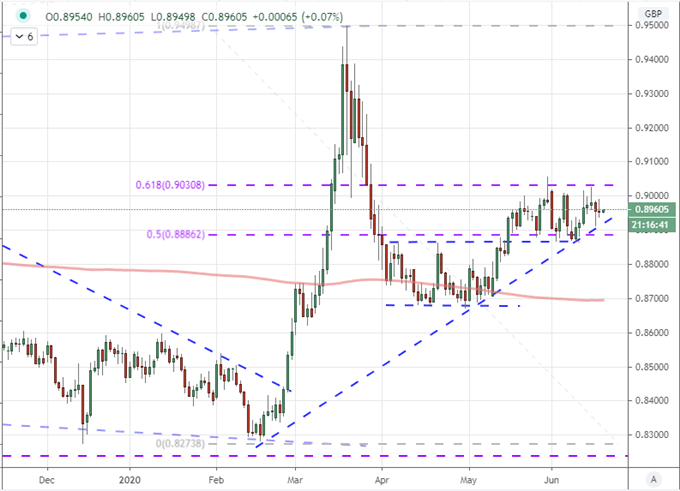
Chart Created on Tradingview Platform

If you want to download my Manic-Crisis calendar, you can find the updated file here.
.


