


S&P 500, Crude Oil, Gold Talking Points:
- The S&P 500 joined other global indices with a jump through Wednesday’s session, but the follow through didn’t seem to fit the bullish narrative
- Reports of a successful coronavirus drug from Gilead didn’t carry capital markets higher, nor did a tweet from the US President about retaliating against Iranian ships spur ‘risk off’
- Recession reports were a common refrain this past session between updates from Reuters and Fitch but April PMIs Thursday carry more weight in my book
Risk Appetite That Doesn’t Fit Netflix Earnings Nor Fresh US Stimulus
Shortly after closed Tuesday’s New York trading session, a run of (typically) favorable news crossed the wires. The reports that the US government was pushing through another $484 billion in stimulus to supplement that tapped program for small business loans spoke to the prime mover in the recent systemic fundamental equation. Yet, just in case that wasn’t enough, FAANG member Netflix reported earnings after the bell that seemed to show that some companies – including speculative favorite tech firms – may be able to better weather the ‘Great Lockdown’ (the IMF’s description of our current recession course as compared to the Great Recession and Great Depression in 2008 and the 1930s respectively). Yet, neither event seemed to prompt the kind of enthusiasm one would expect in ‘normal’ conditions. While we did see the S&P 500 join many of its global peers with a gap higher, the move was neither extraordinary nor particularly concentrated in the US market’s favor.
| Change in | Longs | Shorts | OI |
| Daily | 1% | -1% | 0% |
| Weekly | 15% | -13% | -1% |
Chart of S&P 500 with Daily Gaps and Rate of Change Overlaid with SPX/VEU (Daily)
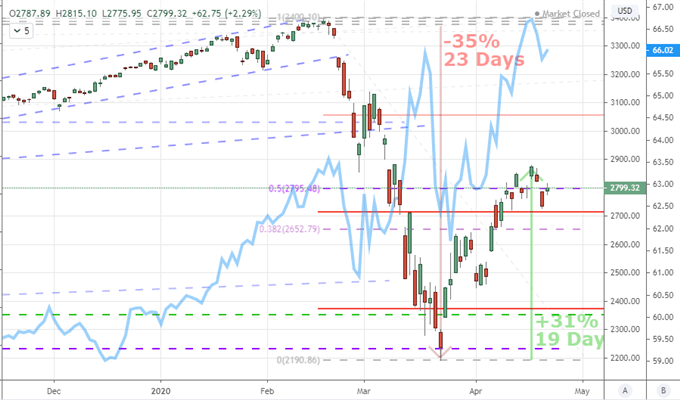
Chart Created on Tradingview Platform
In the recovery that has been mounted among the risk-leaning assets I tend to follow, few can match the pace of the US indices. That isn’t surprising given their outperformance over the past decade. Yet, when I look around the speculative landscape, the conviction in recovery seems to draw serious reason for doubt. Struggle for the likes of emerging markets and high yield fixed income aside, the European and Asian indices have carved out less robust rallies while chart patterns reflect more distinct consolidation. If you don’t already, it may be time to consider the German DAX, UK FTSE 100 and Japanese Nikkei 225 alongside the US indices when tracking speculative bearings through the immediate future.
Chart of DAX Index (Daily)
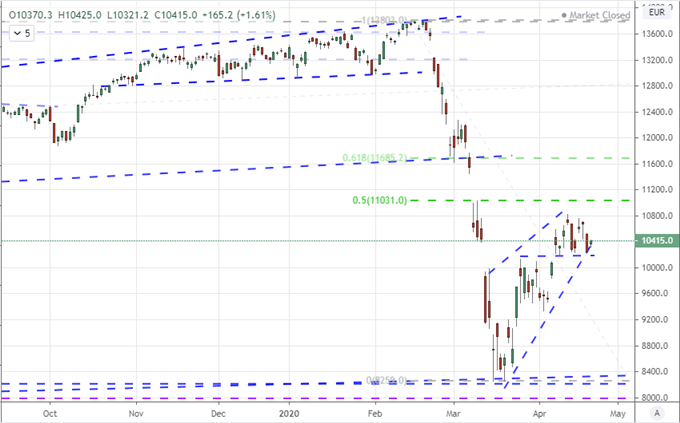
Chart Created on Tradingview Platform
Geopolitical Pressure Vies For Attention Alongside Stimulus and Recession Warnings
While the push and pull of high-level data continues to compete with the balance between recession risk and stimulus iteration, it is important to recognize that these ‘standards’ are not the only forces acting upon the global markets. I was reminded of that this past session by a tweet from US President Donald Trump who advised his Navy via social media to ‘destroy’ Iranian vessels that harassed US ships. Such as statement issued through either diplomatic or unorthodox channels would have previously been spark for serious concern. Nowadays, they seem to be treated more like background noise. Learn more on fundamental basics for your analysis.
Chart of Economic Policy Uncertainty for United States
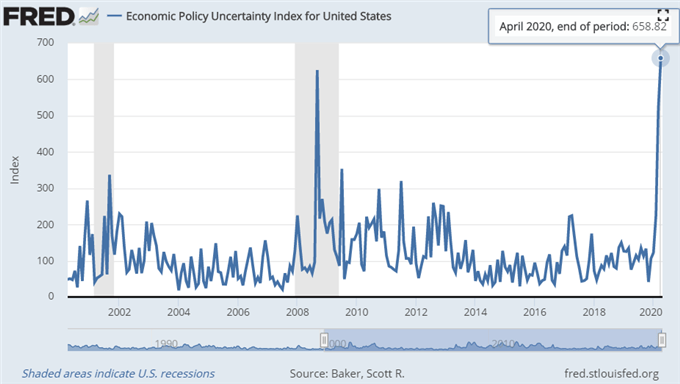
Chart from Federal Reserve Economic Database
Another consideration outside the standard fundamental equation remains the headline references to the spread of the coronavirus. Markets have grown hardened to the updates of verified cases and deaths or perhaps the slowing pace is a point for optimism. That said, it is remarkable that last week there was such a sharp response to rumors that biopharmaceutical Gilead was showing success with its coronavirus drug, yet there is little momentum to speak of there. Further, PRED and WORX shares halt for similar news seems to draw little macro interest at all. Anticipation of an anticipated recession on the other hand would seem to carry the most tangible weight, yet its market sway has generated limited market response.
Chart of Global Search Interest in ‘Recession’ and ‘Financial Crisis’ Via Google Trends
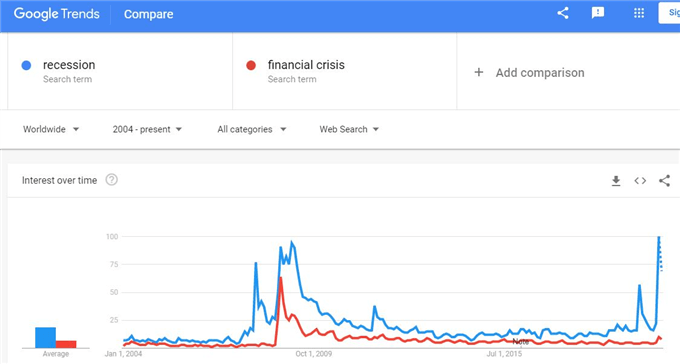
Chart from Google Trends
Top Fundamental Charge Ahead: Global PMIs and Crude Oil Implications
At the top of my list of sparks to monitor closely for the session ahead, the run of initial global PMI readings from Markit for April will offer up the most succinct and timely reading for global economic trajectory that we have. Last months’ update had already reflected severe figures but on a few points they managed to fall short of the acute pain that was projected. Was that just a function of the recording period or perhaps forecasts were indeed too bearish? We will soon find out. Regardless, I put more stock in these monthly figures than the delayed quarterly reports we are awaiting release over the next weeks.
Chart of Global Output by Sector from Markit (Monthly)
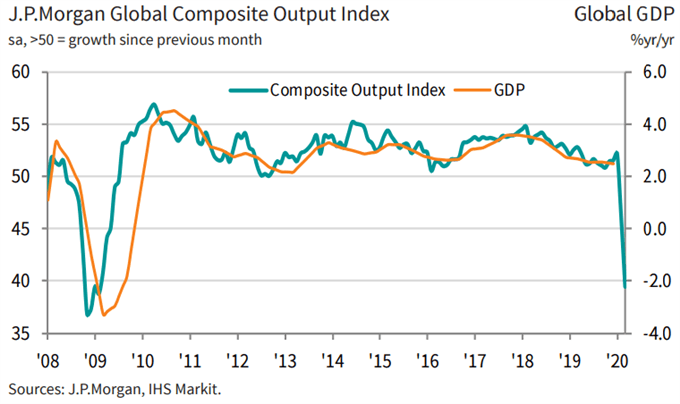
Chart from MarkitEconomics
Another systemic vehicle that I’m keeping close tabs on is the energy market. Crude oil has long been a measure for where economic health crossed speculative current. That relationship has only grown more pronounced as demand has driven an extreme slide in the price of the commodity with the active WTI futures contract flipping to a deep negative reading this past Monday. While the roll forward to the June contracts seems to have returned us to some sort of normal, it hasn’t instituted a recovery. In the meantime, the largest oil-based ETF, USO, continues to suffer in a steep slide on heavy volume while the related oil volatility index holds near levels that were previously untested.
| Change in | Longs | Shorts | OI |
| Daily | 3% | -7% | 1% |
| Weekly | 31% | -38% | 7% |
Chart of USO ETF Overlaid with Oil Volatility Index and Volume (Daily)
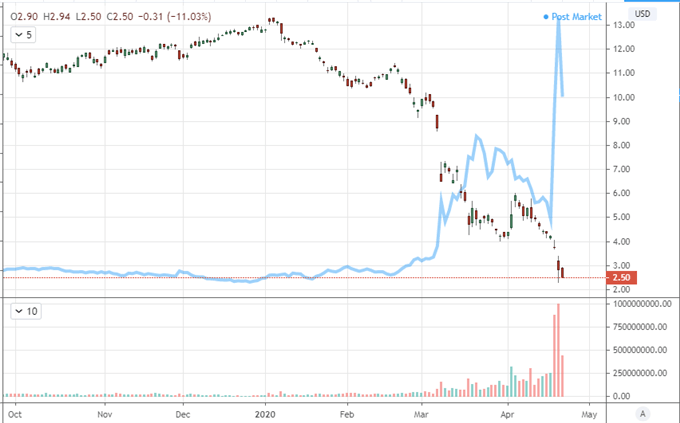
Chart Created on Tradingview Platform

If you want to download my Manic-Crisis calendar, you can find the updated file here.
.


