


- Monday opened to surprising restraint rather than the mania of the past week and panic of the preceding three
- Stimulus has flooded the system and it will need to hold sentiment steady as reminders of a severe recession compound every day
- Top event risk for the day ahead includes US consumer sentiment, a G7 virtual meeting and Chinese PMIs among many others
My Preferred Start to the Week Was the Quiet One
Some market participants may have been disappointed by the way the market opened the new trading week with a measured advance that lacked the tempo of last week’s drive. However, I feel the market performance of the Dow, other global indices, emerging markets, carry trade and other sentiment benchmarks was the most reassuring outcome for which we could have hoped. That said, moderation and the modest bullish bias we’ve experienced could be upended with little warning in this environment. We will face constant reminders that the global economy has stalled paired with the reality that yields have imploded to levels unseen in history. In this type of environment, expecting a full-bore speculative charge would be far-fetched – even speculatively indulgent.
| Change in | Longs | Shorts | OI |
| Daily | -18% | 18% | 7% |
| Weekly | -19% | 14% | 4% |
Chart of Dow with With Opening Gaps and 1-Day Rate of Change (Daily)
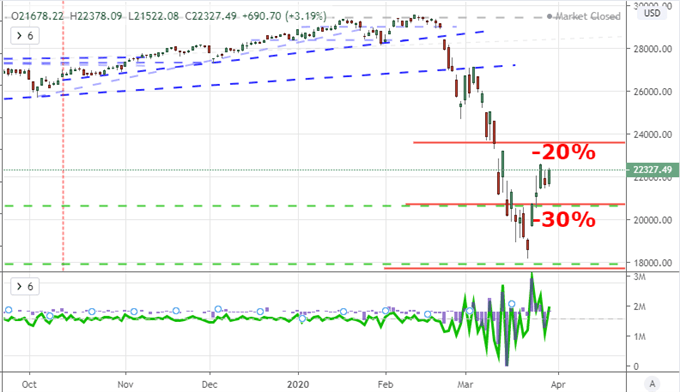
Chart Created on Tradingview Platform
The risk that we run in these markets is the persistently high level of anticipated volatility – versus realized. The popular VIX measure derived from the S&P 500 has experienced much-needed relief from stratospheric levels above 80, but we have not moved much further than 60 despite that retreat. For comparison, that is compared to an average below 20 up until these past two months. What’s more, this is not unique to the US benchmark index. Measures of anticipated volatility remain elevated across the range of speculative assets – and well they should. With historical low rates of return and general market values significantly elevated from historical levels of balance, arguments for collapse are not difficult to muster should the speculative rank panc.
Chart of VIX with S&P 500 Overlaid (Monthly)
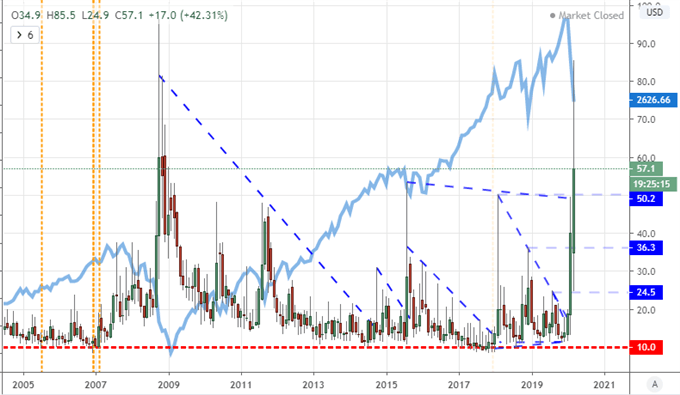
Chart Created on Tradingview Platform
A Constant Push and Pull Between Inevitable Instability and Extreme Stabilizers
The way that I am presently evaluating the fundamental situation moving forward is the push and pull on sentiment. On the one hand, there is substantial optimism supported by the enormous scale of global stimulus that has been implemented just in the past three weeks. The effort is global and pushing well into trillions globally. That will help offset considerable pain. But is it sizable enough to compensate for the worst economic retrenchment since the Great Depression? The economic docket will be a constant reminder as we march deeper into the March and April releases that we are already head first into a recession. Is the stimulus that has already been approved enough? Are subsequent programs like the one the US Speaker of the House suggests will be proposed on April 20 enough? That is up to the collective interpretation of the masses, and I will be watching very closely.
Chart of Google Trends in ‘Recession’ and ‘Recession’
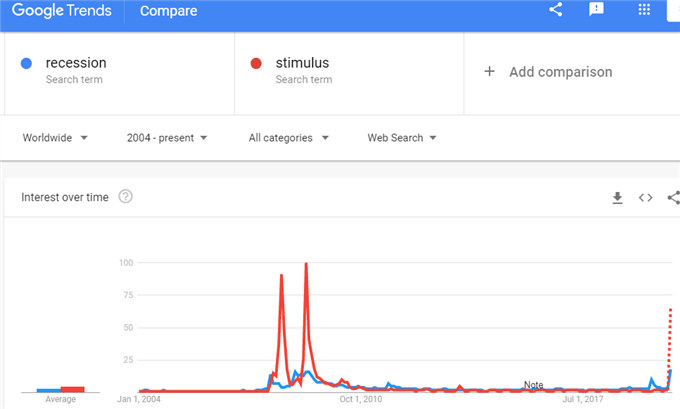
Chart from Google Trends
As the global scales tip back and forth, I will be taking in the high profile updates that are on the immediate horizon. The top economic listing through Monday’s session were the Eurozone sentiment surveys which were surprisingly better than expected (economy confidence figure was 94.5 versus 91.6) but unquestionably poor in notional terms. Tuesday will be much weightier in event heft. Already, we have seen Chinese PMI figures for March from the NBS; and I certainly find myself questioning the data. A 53.0 reading following February’s 28.9 should raise serious questions. Further ahead, the G20 finance ministers and central bank governments will offer a collective update though the probability of expending more of their dwindling resource seems dubious at best. More open to variability will be the US-based Conference Board’s consumer sentiment survey. Coming after the University of Michigan reading, this report will give a health check on the largest collective GDP lever in the world deeper into the US lockdown.
Chart of Wilshire 5000, Equity Market Related and US Economic Policy Uncertainty (Weekly)
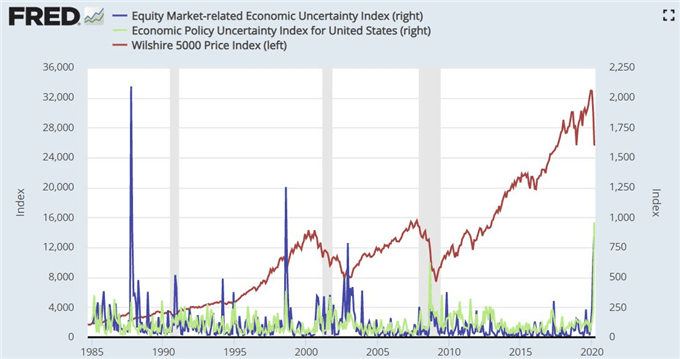
Graph from Federal Reserve Economic Database

Speculative Anticipation Will Shift Before the Statistics are In
As we watch the economic docket and headlines for updates on our current status, it is important to remember the nature of speculative markets. They tend to be moved by anticipation for the future built as much on collective interpretation as tangible data itself. That is why I’m keeping mind of speculative sentiment. Referring to my Twitter poll at the end of last week, approximately 83 percent of those that replied believed our recent bounce is frankly that: a temporary reprieve from a prevailing trend. That is fairly close to the IGCS reading for the S&P 500 which stands at approximately 70 percent net short.
Poll from Twitter on the Dow’s Trend
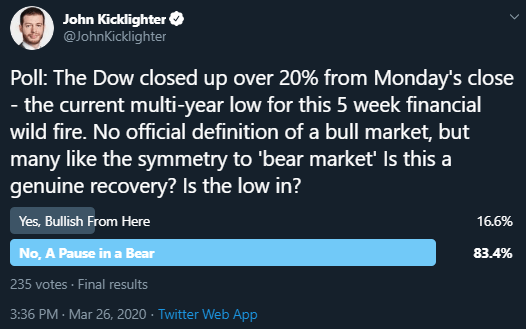
From Twitter Handle @JohnKicklighter
Not all speculative bearing has a bearish bias. In a remarkably stark contrast to the ‘risk off’ view of the US indices, the growth-leaning sentiment gauge of US oil markets carries a remarkably bullish bias. The commodity via IGCS CFD positioning has been over 75 percent net long since mid-January, but the sale of long interest alone these past weeks has surged. Trading at a 17-year low, this is an ominous statement on the economic outlook and reminder that speculative interests alone cannot fuel the economy.
| Change in | Longs | Shorts | OI |
| Daily | 3% | -7% | 1% |
| Weekly | 31% | -38% | 7% |
Chart of US Crude Oil CFD Positioning at IG (Daily)
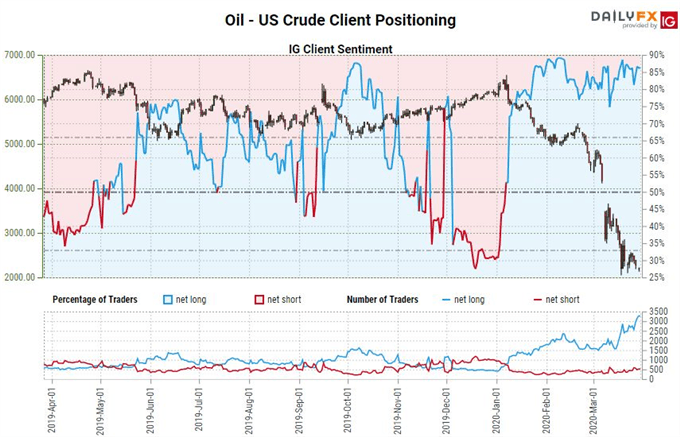
Chart from DailyFX.com
If you want to download my Manic-Crisis calendar, you can find the updated file here.
.


