


VIX, S&P 500, EURUSD Talking Points:
- While the S&P 500’s ATR has hit extreme levels there has been little consistency to trend, but the VIX’s 10 year high paints a troubled picture
- Should fear remain, high-level event risk due in the week ahead like economic and consumer sentiment reports could generate greater impact
- A full-blown Dollar tumble makes for the most pressing currency to monitor while the ECB rate decision is top event risk and added EURUSD lever
Volatility Remains the Hallmark of the Markets
We closed out this past week with a consistently dramatic level of volatility paired with an incredibly unmoored perspective of trend. Normally, the assumption is that there is a mirrored performance between a sentiment benchmark like the S&P 500 and underlying activity measures such as the VIX. Yet, that isn’t always the case as we can see. The implied volatility index is derived from the expectations of options traders in the underlying index. Since a commanding proportion of equity market participants are ‘long only’ and the options priced from the measure are frequently hedges, there tends to be a negative correlation and general alignment to sentiment. That said, volatility cannot continuously rise or fall like the index. Eventually it normalizes even as price trends persist.
| Change in | Longs | Shorts | OI |
| Daily | 1% | -1% | 0% |
| Weekly | 15% | -13% | -1% |
Chart of S&P 500 with Tails (Daily)
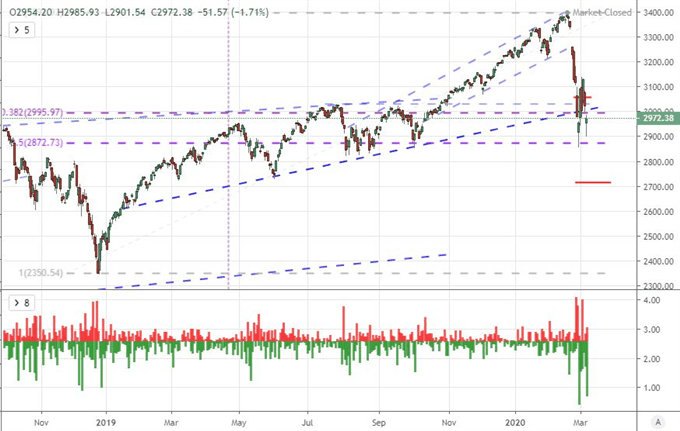
Chart Created on Tradingview Platform
Through the past week, the frequency of switch backs from risk-leaning assets was furthered a signal of indecision alongside the enormous gaps and tails measured by benchmark indices. For the S&P 500, the 10-day (2 trading week) average true range hit a record high in points terms – and the highest level as a percentage of spot since August 2011. As for the daily gaps and tails (frequency and scale), the figures are unprecedented. While high volatility levels out naturally, there is nothing that says that it has to happen in the week ahead. Another swell will be extended if there is even a brief interlude whereby fundamental momentum kicks in for a spell. Keep tabs on volatility, correlation and momentum across high speculation and haven assets to keep an overview on the financial system.
Google Global Financial Search Results for ‘Volatility’ and ‘Recession’ (Weekly)
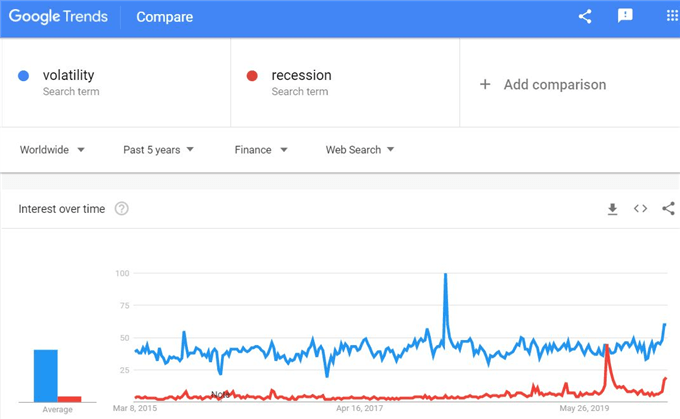
Graph from Google Trends
Dollar Will be Focus of the FX Market As Themes Compete, Technicals Breach
While volatility was a universal influence, the most impressive performance with a clear bead through the end of this past week was the performance from the US Dollar. The DXY Index’s 2 percent dive this past week was the worst performance over that period since May 2017. For the two-week tumble covering over 3.7 percent, we are seeing the worst slump since early 2016. This scale of pressure is not universal for the Greenback. The slide is most overwhelming compared to the Euro, though recent declines relative to the Pound and Yen are difficult to miss. Meanwhile, carry counterparts like AUDUSD and NZUDSD are offering up relatively little traction while the Dollar actually gained materially against emerging market currencies like the Brazilian Real, Russian Ruble and Mexican Peso.
Chart of DXY Dollar Index with 2-Week Moving Average (Weekly)
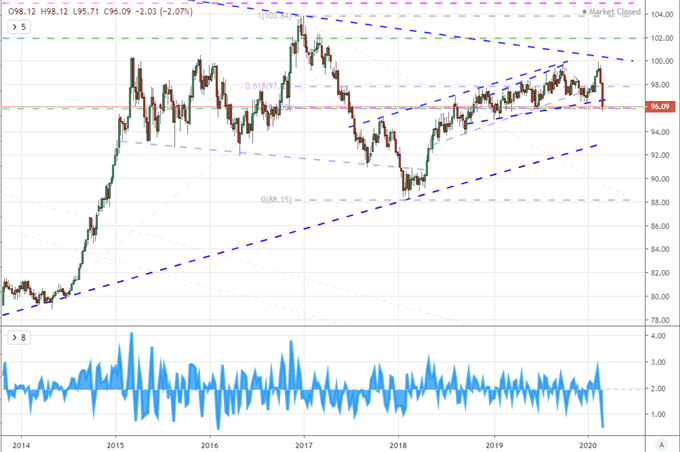
Chart Created on Tradingview Platform
The Dollar is a market in which the fundamental overlap can help determine what conflicting themes are prevailing. For example, it would seem that the volatility of late would bolster risk aversion which in turn raises the appeal of this most renowned liquidity currency. Yet, the opposite has occurred for the Dollar. Before we start labeling the USD a carry currency losing altitude, it is worth mentioning that the Australian and New Zealand counterparts are not showing that kind of performance. Relative growth is another matter that has helped US assets gain against counterparts in previous years, but the battering economic forecasts have taken these past weeks has not been isolated to the US. It would seem that the collapse in rate forecasts for the Fed – which holds carry and growth implications – is the most prominent feature. Even if that is the case, rates are so low and anticipation so pressurized, it would be difficult to continue on this fundamental path.
Chart of DXY Dollar Index with Implied Fed Funds Forecast for 2020 (Daily)
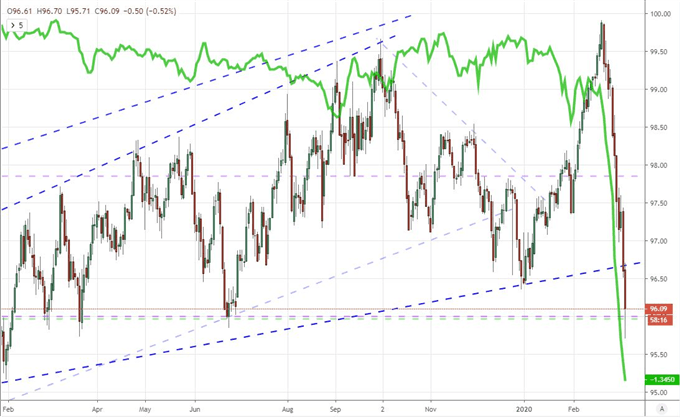
Chart Created on Tradingview Platform
EURUSD, Fundamental Themes and Key Event Risk
Looking out over the coming week, there are some higher-level events that are distributed out over the week. How market moving they prove is likely to depend heavily on the market’s sensitivity to thematic events and the bias in underlying sentiment. Fear over the coronavirus is s starting point for a more convoluted view of simmering fears. Growth for example is garnering sharper attention as the search volume for recession rising once again. The US 10-year to 3-month yield curve has normalized this past week, but the 10-year Treasury benchmark itself has collapsed to a record low. Meanwhile, crude oil prices registered a painful, 10 percent drop through Friday alone. As the economic pressure rises, so too does the potential for competitive policy aimed at generating growth through the throttling of trade and thereby the health of partner economies.
| Change in | Longs | Shorts | OI |
| Daily | 3% | -7% | 1% |
| Weekly | 31% | -38% | 7% |
Chart of US Crude Oil with 20-Day Moving Average and 1-Day Rate of Change (Daily)
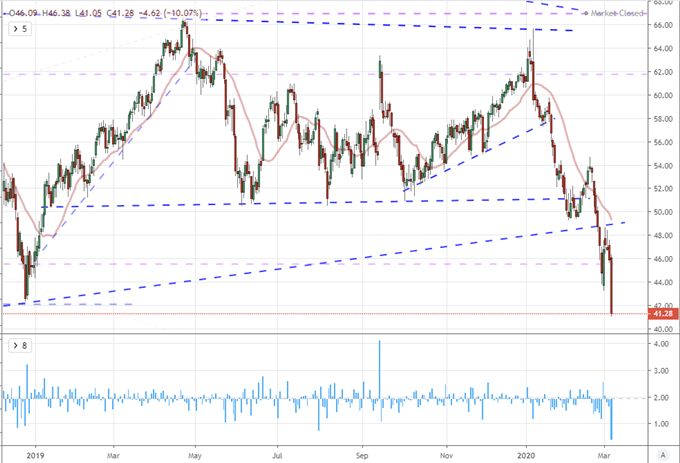
Chart Created on Tradingview Platform
A top event risk for concentrated influence and connection to theme this week is the European Central Bank (ECB) rate decision. This past week, the G7 meeting of finance ministers and central bank heads issued a commitment to beat back the troubling financial clouds with a broad commitment to do anything necessary to promote growth – though no details were offered. The Fed’s emergency 50 bp rate cut set the tone for responsiveness, but the market’s quick reversal of the immediate gains following the news showed a single effort may not be enough. A 50bp BOC cut and 25bp RBA easing showed a comprehensive effort at play, so now the turn falls upon the ECB. If the group doesn’t offer some form of further accommodation, it may signal to the market hat the firefighting is inconsistent and more readily loses traction with maintaining bullish sentiment. It would even worse in my estimation, however, if the European authority did ease and sentient still lost traction – much like the Fed.
| Change in | Longs | Shorts | OI |
| Daily | -1% | -4% | -3% |
| Weekly | 4% | -10% | -5% |
Chart of EURUSD with 20-Day Moving Average (Daily)
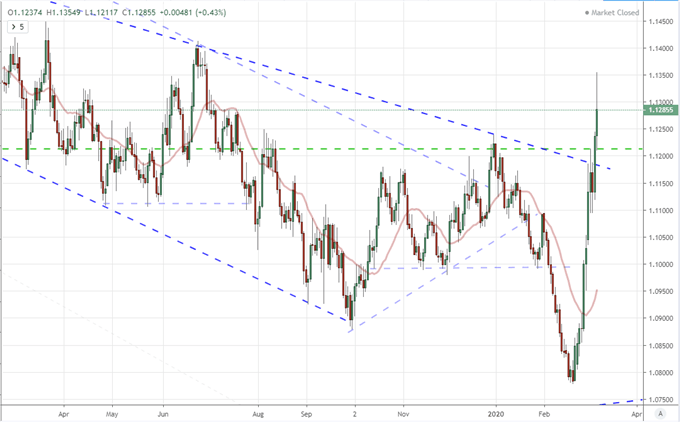
Chart Created on Tradingview Platform
If you want to download my Manic-Crisis calendar, you can find the updated file here.
.


