


Talking Points:
- The S&P 500 suffered its second largest gap down on the open on record Tuesday, moving the index to critical support
- A vortex of liquidity is immediately off the bow, meaning it is critical to evaluate all trade setups with the drain in mind
- Crude oil's brief respite ended with a drop now at 30%, Trump weighs in on Fed rates, the OECD is due to update economic forecast
What makes for a 'great' trader? Strategy is important but there are many ways we can analyze to good trades. The most important limitations and advances are found in our own psychology. Download the DailyFX Building Confidence in Trading and Traits of Successful Traders guides to learn how to set your course from the beginning.
Are US Equities Threatening to Enter Bear Trend Despite the Holidays?
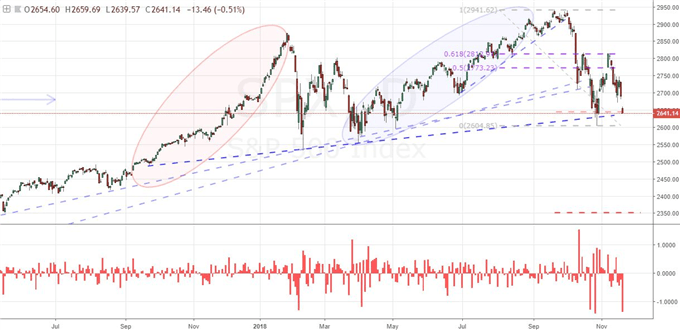
We are marching assuredly into a seasonal liquidity drain for US markets with Thursday's Thanksgiving holiday closure close at hand. Yet, despite the hurdle that this poses for facilitating a fruitful trend by drawing out the speculative oxygen necessary to fuel any fires, the US indices continue to follow an overt and provocative bearish course. The S&P 500 leads the symbolic pack with its second worst gap lower on the open on record - the fact that the largest was less than a month ago is even more concerning to me. Flashes of volatility are to be expected as unforeseen developments are inevitable. However, extreme market moves grouped closely together is more likely a sign of systemic instability coming to the speculative surface. The drop from the index was primarily suffered through the open with little follow through active trade. That held the market back from breaking through an important trendline support now immediately below. In contrast to the SPX, the blue-chip Dow and Nasdaq 100 indices are in very different positions. The former suffered its own record-breaking gap lower (back to 2001) but finds itself with a health buffer to its own medium-term, bull-trend floor. Alternatively, the Nasdaq spun its own jump lower to start Tuesday into a clear break of support. It is possible that the tech-heavy index can continue to run while its compatriots stabilize in accordance with liquidity conditions, but that is highly unlikely.
Chart of S&P 500 and Measure of Opening Gaps (Daily)
Looking to the Themes that Would Sustain a Trend and Relative Performance for Scope
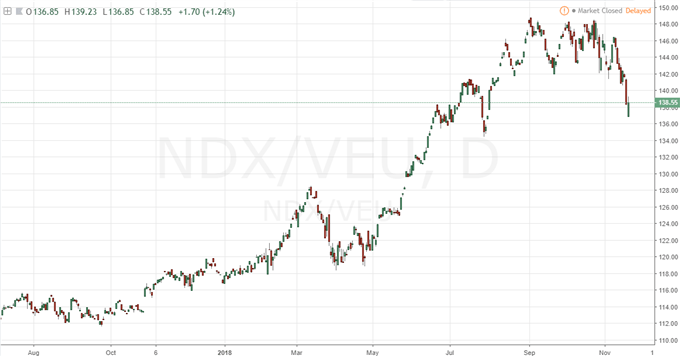
If the markets are signaling an intent to capsize into full-tilt risk aversion despite the break in liquidity for the world's largest financial hub, we should look for the drive that would power such a move. To compensate a known draw on market depth, we need to see something profound compensate for the lack of participation to draw more activity through those access points to the global financial system that are still open. Pure, unadulterated 'animal spirits' is always possible, but that is usually a reference to crucial breaks in the availability of funding and an amplified need to bail. In this way, thin market conditions can actually exacerbate a sense of panic and ensure the flight. However, there remains an important caveat that undermines this clear path: the drive for risk aversion is not showing through uniformly across regions and asset classes. If we were to compare the US indices to their global counterparts, we find that the pain is far more acute with the former. The same disparity comes through in the comparison to other risk-aligned assets - emerging markets, junk bonds, carry trade, government bonds and more. What would explain this? The US equity market has proven the best overall performer amongst the major asset classes in the past years and has exhibited this disparity clearly in 2018 as bulls have held back the tide far more effectively than most other asset classes. That retains a 'premium' to this segment of the world's risk group which means it has the most to lose should the market's converge lower. While we have a global turn in government bond yields, the OECD is due to update growth forecasts Wednesday and global monetary policy is posing an ongoing threat; these aren't necessarily overbearing and active drivers. If US equities are simply moving to coincide with its market-wide counterparts, it will more likely abide liquidity. That said, it can still prove an active driver when the tide rolls back in.
Chart of the Ratio of the Nasdaq 100 to VEU All World ex US Index (Daily)
EURUSD Fails to Follow Up on a Break, President Trump Laments the Fed Once Again
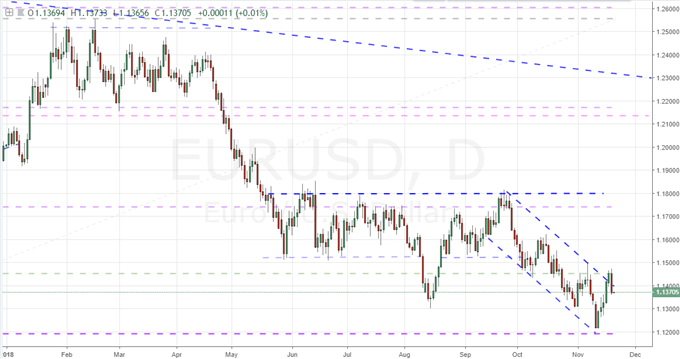
On Monday, the FX market's benchmark exchange rate put in for a technical break that many would accept as immediate qualification for a technical break without follow through potential. And yet, that move failed promptly the day after lift off. The shortcomings of this effort were many. Fundamentally, the prompt for a Dollar tumble looked flimsy. There are certainly threats to the Greenback including its carry trade saturation, sensitivity to risk trends, trade wars position and political uncertainties. Yet there was little pushing these themes to the surface specifically this week. The motivations for the Euro to mount a true rally were far more flimsy. The dual front between Brexit and Italy's budgetary belligerence represents an open-ended risk. Other possible outlets of strength like relative growth and interest rate speculation are currently lacking for charge. More than the limitations on the economic docket - which remains the case over the next 24 hours for this pair - are the liquidity conditions of the market and lack of confirmation in speculative charge for the currencies individually. Whether the trade-weighted DXY, the equally-weighted Dollar or the equally-weighted Euro; the picture is the same. The market moved to the technical boundary but failed to make the critical next step. Even if they managed to earn the spark, the lack of fuel to power the moves through is an issues for the market at large. It is important to remember the low tide will only last for so long. President Trump revived his effort to jawbone monetary policy this past session. He echoed that he wanted the benchmark rate lower likely in a combined interest to lower the cost of a building debt and to weaken the Dollar in order to lessen the strain from the trade wars. On the Euro docket, there were reports that the European Commission officials were due to trigger excessive debt procedure (EDP) against Italy. A tangible step in this direction will do little to deflate Italian yield differentials.
Chart of EURUSD (Daily)
What to Expect from Brexit and the Energy Market as Event Risk and Momentum Continue
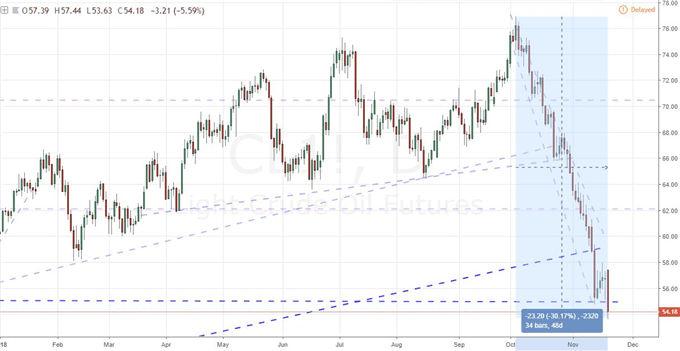
If you were looking for the most loaded (potential) fundamental charge in the market, the British Pound would be near the top of the list. Brexit remains the most pressing and yet troublingly complicated issue facing one of the major currencies/regions. Following last week's extreme reverse in fortunes from a seeming breakthrough with a draft acceptable by both Prime Minister May and top EU negotiators to the outright rejection of the draft deal by her government and the resignation of important senior members, the Sterling's path has grown increasingly troubled. In plotting the Sterling's next move, it is important to ensure the next step can offer viable progress. In the upcoming session, Prime Minister May is due to meet European Commission President Jean-Claude Juncker where the topic is obvious. However, the agreement between these two players is not the current roadblock to an ultimate resolution. The approval of May's government is the current missing piece. And, that is a course without an explicit time table. This past session, Bank of England (BOE) Governor Mark Carney and some of his colleagues testified before the Commons and voiced support for May's plan and reiterated its warning of what could befall the country in the event of a 'no deal' Brexit. In contrast to the potential energy in the Pound, there is explicit kinetic momentum from crude oil. A brief, three to four day pause for the commodity following its epic six week tumble was summarily broke up with a drop this past session that shed as much as 7.5 percent by the day's low. It was very telling that this key market measure managed no genuine recovery when it managed to stabilize. A floor will eventually be found, but in the meantime, crude oil is down 30 percent from October's peak and trades at a 12 month low with no reliable signal to its end. This is a good reminder that it is important to find evidence to build conviction of a trend change commensurate to the intensity of the preceding trend. We discuss all of this and more in today's Trading Video.
Chart of US WTI Crude Oil (Daily)
If you want to download my Manic-Crisis calendar, you can find the updated file here.


