


Gold Price Outlook:
- Gold prices have rebounded after dipping following the July US jobs report, trading back to multi-month trendline resistance.
- The upcoming July US inflation report could prove to be a catalyst should price pressures show enough deceleration (thereby preventing a rise in Fed rate hike odds).
- According to the IG Client Sentiment Index, gold prices still have a bullish bias in the near-term.

Yet to Clear the Hurdle
Gold prices survived their first fundamental obstacle last week, weathering the blowout July US nonfarm payrolls report. A second fundamental obstacle has now appeared, with the July US inflation report due out on Wednesday. Like the July US jobs report preventing a bullish breakout for gold prices, the incoming US inflation data could likely prove make-or-break for gold prices in the short-term.
A deceleration in US inflation rates could prevent a further rise in Fed rate hike odds and thus US Treasury yields, weighing on US real yields, which would be a positive development for gold prices. On the other hand, signs of persistently elevated US price pressures could provide a new spark for Fed rate hike odds and US Treasury yields, allowing US real yields to rally and sinking gold prices. This week, what’s good for the US economy – lower inflation – is also good news for gold prices, as it translates into the perception a less hawkish Federal Reserve.
Gold Volatility Steady Near June Lows
Historically, gold prices have a relationship with volatility unlike other asset classes. While other asset classes like bonds and stocks don’t like increased volatility – signaling greater uncertainty around cash flows, dividends, coupon payments, etc. – gold tends to benefit during periods of higher volatility. With a new fundamental regime forming in the wake of the July Fed meeting, lower gold volatility has proved to be beneficial for gold prices.
GVZ (Gold Volatility) Technical Analysis: Daily Price Chart (August 2021 to August 2022) (Chart 1)
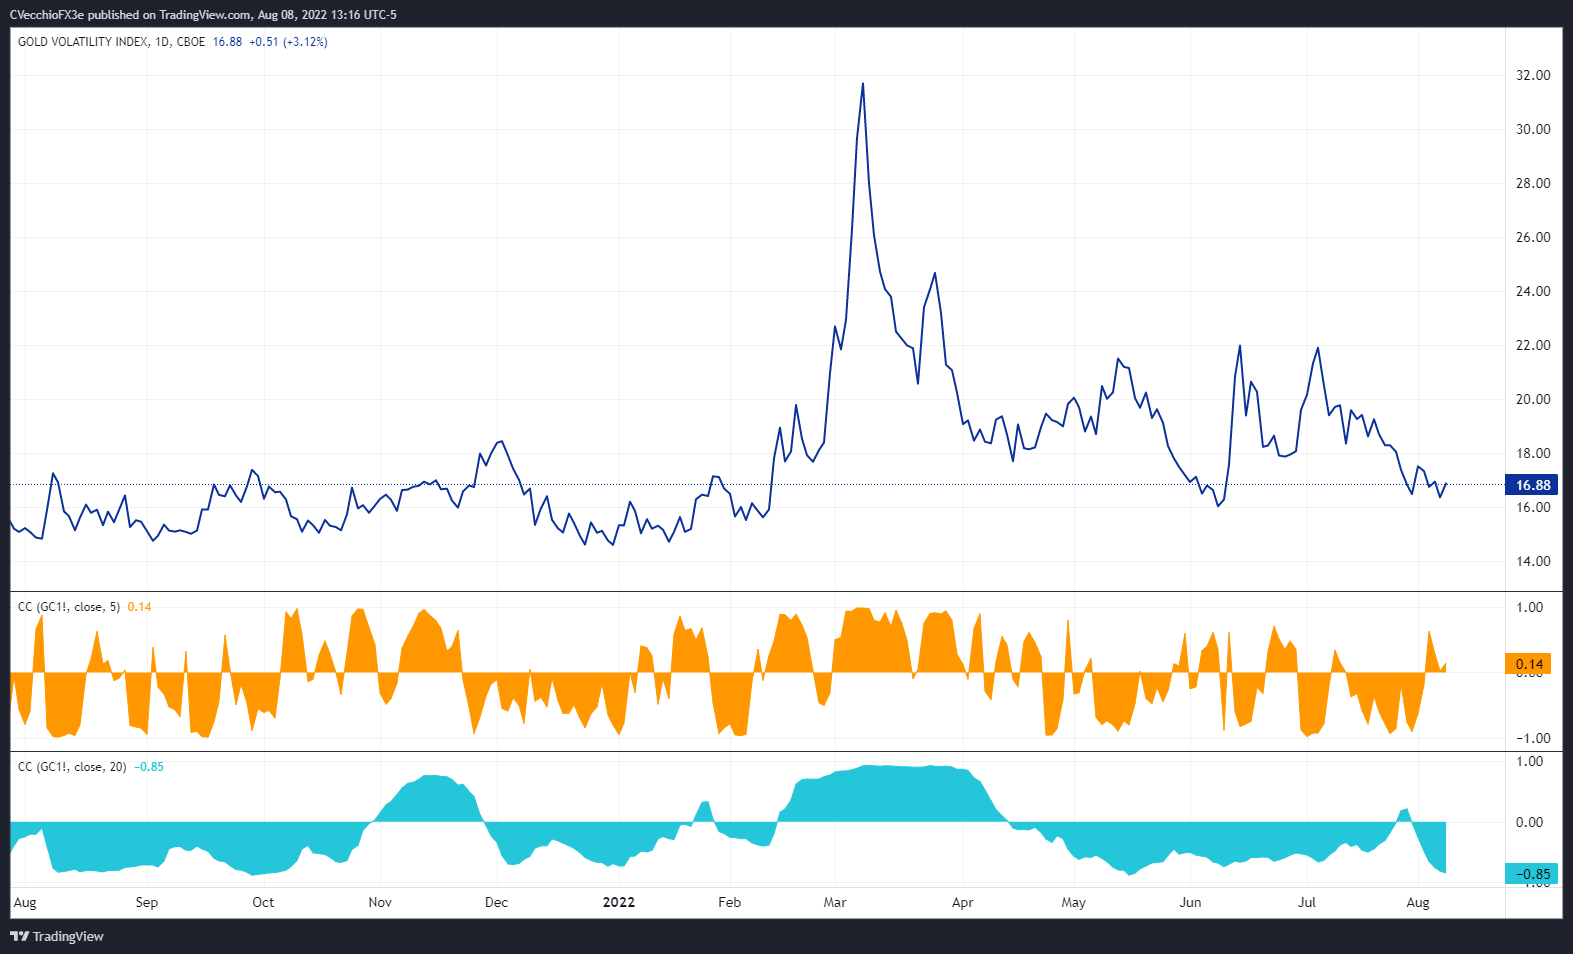
Gold volatility (as measured by the Cboe’s gold volatility ETF, GVZ, which tracks the 1-month implied volatility of gold as derived from the GLD option chain) was trading at 16.88 at the time this report was written. The 5-day correlation between GVZ and gold prices is +0.14 while the 20-day correlation is -0.85. One week ago, on August 1, the 5-day correlation was -0.63 and the 20-day correlation was -0.26.
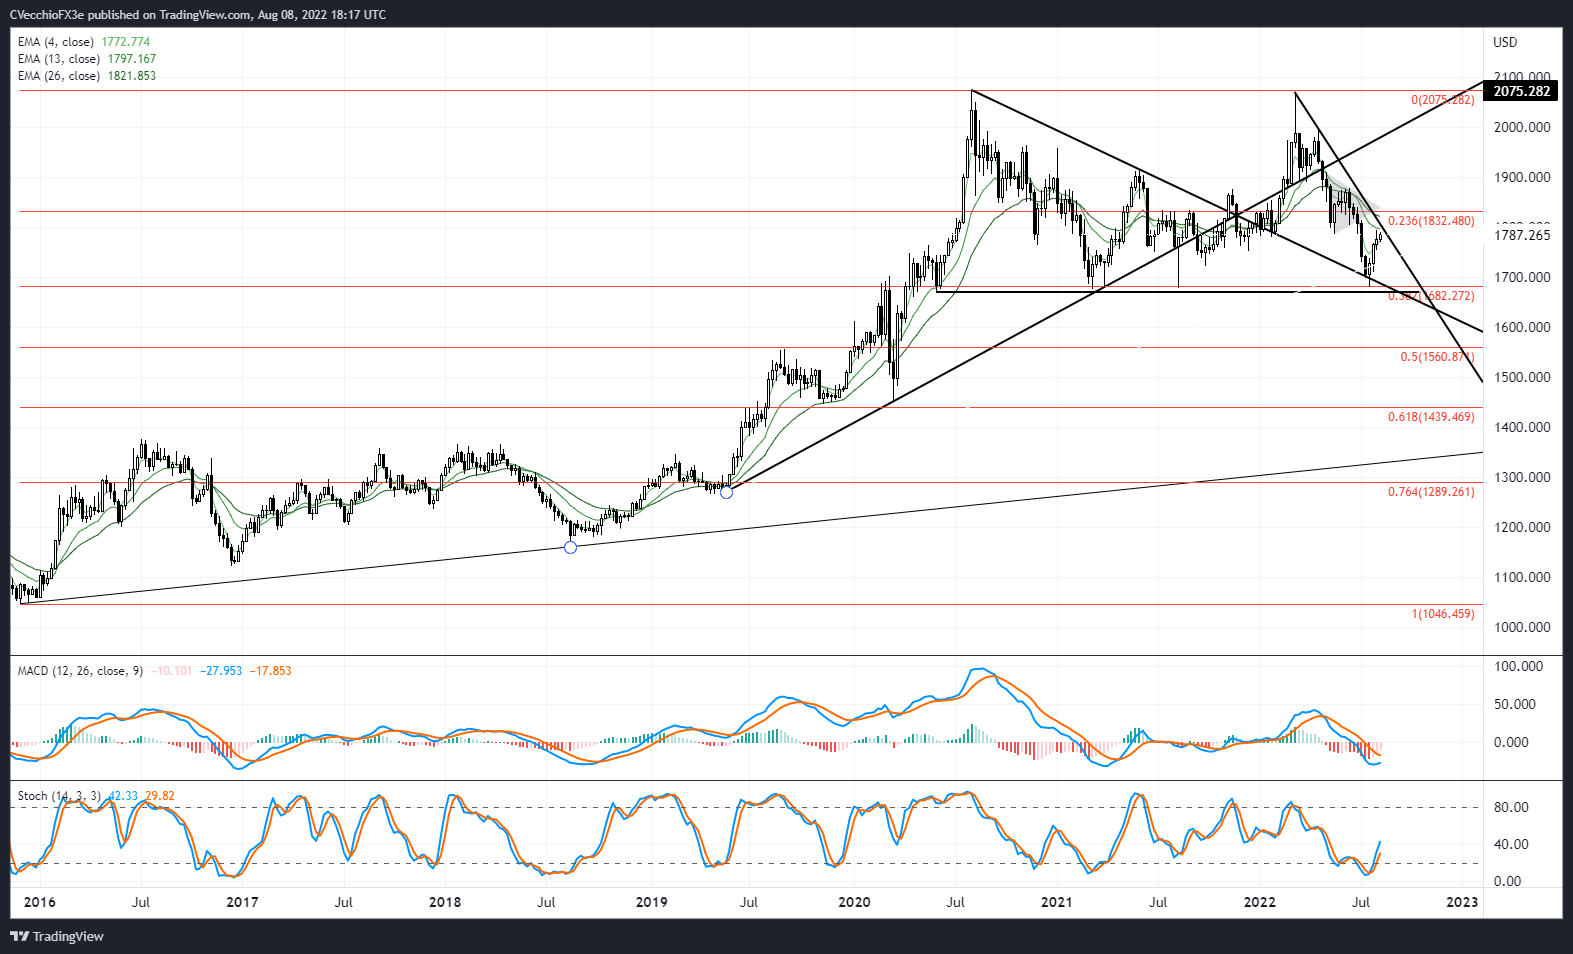
Gold Price Rate Technical Analysis: Daily Chart (August 2021 to August 2022) (Chart 2)

Last week it was noted that “gold prices [have]…arrived at their first major technical hurdle,” the descending trendline from the March and April swing highs near 1800, and that “the July US NFP report could help catalyze a short-term reversal back under 1760 or a breakout towards 1832 in the coming sessions.” Gold prices hit a low near 1765 after the blowout July US jobs report on Friday.
Since then, gold prices have been edging their way higher once more, trading back to the multi-month descending trendline. Resistance near 1800 hasn’t been broken yet, but the upcoming July US inflation report could prove to be a catalyst should price pressures show enough deceleration (thereby preventing a rise in Fed rate hike odds).
The momentum profile continues to firm. Gold prices are trading above their daily 5-, 8-, 13-, and 21-EMA envelope, which remains in bullish sequential order. Daily MACD is rising through its signal line, while daily Slow Stochastics are holding in overbought territory.
Gold Price Technical Analysis: Weekly Chart (October 2015 to August 2022) (Chart 3)
The longer-term view holds: “a double top remains in place, but a quadruple bottom around 1680 warrants a reconsideration: a massive sideways range between 1680 and 2075 may have formed. A bounce from 1680 sees 1800 as the first area before resistance is found. The sudden shift in the environment suggests that the daily timeframe (and lower, like the 4-hour timeframe) will be better suited to pay attention to over the coming days/weeks as it will take a long time for technical indicators to evolve on the weekly timeframe.”

IG CLIENT SENTIMENT INDEX: GOLD PRICE FORECAST (August 8, 2022) (Chart 4)
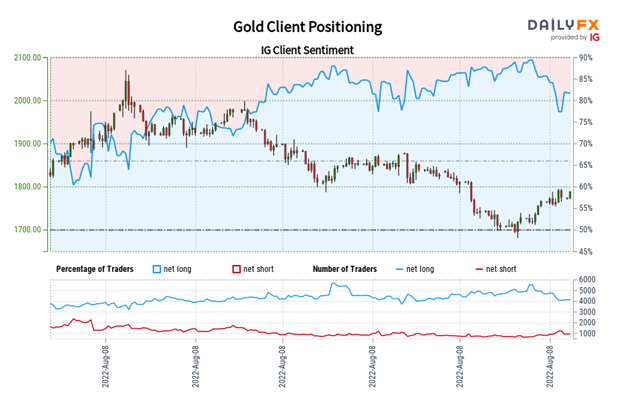
Gold: Retail trader data shows 79.40% of traders are net-long with the ratio of traders long to short at 3.85 to 1. The number of traders net-long is 3.84% higher than yesterday and 8.93% lower from last week, while the number of traders net-short is 18.60% higher than yesterday and 21.17% higher from last week.
We typically take a contrarian view to crowd sentiment, and the fact traders are net-long suggests Gold prices may continue to fall.
Yet traders are less net-long than yesterday and compared with last week. Recent changes in sentiment warn that the current Gold price trend may soon reverse higher despite the fact traders remain net-long.
Trade Smarter - Sign up for the DailyFX Newsletter
Receive timely and compelling market commentary from the DailyFX team
--- Written by Christopher Vecchio, CFA, Senior Strategist


