


Gold Price Outlook:
- Gold prices are moving up for one reason: a weaker US Dollar; US real yields remain in positive territory.
- Gains towards 1880 can’t be ruled out in the near-term before resistance comes into play.
- According to the IG Client Sentiment Index, gold prices hold a bullish bias in the near-term.

A Temporary Reprieve
Gold prices have rallied at the start of June, quickly bringing the precious metal back to the highest levels seen since May 9. But the turnaround in gold’s fortunes appear to be constrained to a select few currencies, mainly the Japanese Yen and US Dollar, both of which have weakened against a basket of their peers over the past two weeks (e.g. XAU/CAD and XAU/EUR have not made significant rebounds). The rally in gold prices – at least in USD-terms – may be more a function of their denomination rather than a legitimate change in fortunes.
Fundamentally speaking, nothing has changed materially. A weaker US Dollar is proving to be a tailwind, but the main rationale for not having a longer-term bullish perspective – rising US real yields – remains valid. The technical turnaround may still have some legs, however, but it’s viewed with a degree of cynicism that warrants a ‘sell the rally’ mindset.
Gold Volatility Drops, Surprisingly Helping Gold Prices
Historically, gold prices have a relationship with volatility unlike other asset classes. While other asset classes like bonds and stocks don’t like increased volatility – signaling greater uncertainty around cash flows, dividends, coupon payments, etc. – gold tends to benefit during periods of higher volatility. Curiously, the multi-week plunge in gold volatility has been met by a rise in gold prices, a historically unusual occurrence.
GVZ (Gold Volatility) Technical Analysis: Daily Price Chart (May 2021 to May 2022) (Chart 1)
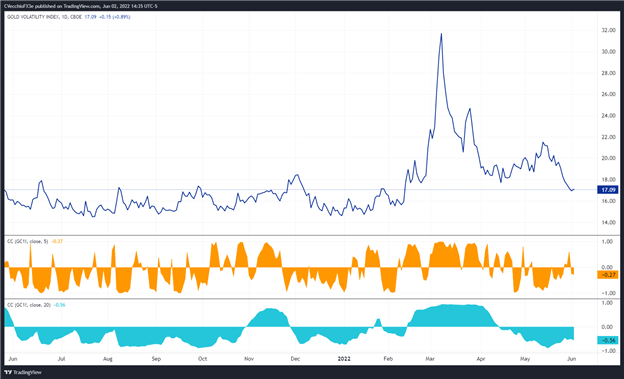
Gold volatility (as measured by the Cboe’s gold volatility ETF, GVZ, which tracks the 1-month implied volatility of gold as derived from the GLD option chain) was trading at 17.09 at the time this report was written. The 5-day correlation between GVZ and gold prices is -0.27 while the 20-day correlation is -0.56. One week ago, on May 26, the 5-day correlation was +0.13 and the 20-day correlation was -0.45.
Gold Price Rate Technical Analysis: Daily Chart (June 2021 to June 2022) (Chart 2)
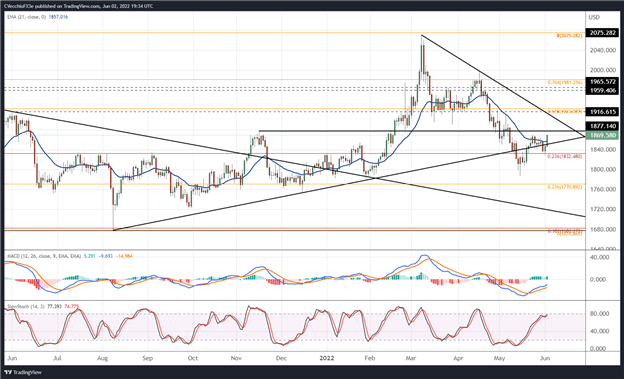
Gold prices are back above their daily 21-EMA (one-month moving average) today, and in turn have traded to their highest level in three weeks. The rebound yesterday that continued into today started near the 23.6% Fibonacci retracement of the 2015 low/2020 high range at 1832.48, suggesting that a near-term swing higher towards dynamic support/resistance dating back to November 2021 near 1877 is possible. While bullish momentum is improving – daily MACD is climbing, but remains below its signal line, and daily Slow Stochastics are approaching overbought territory – there is not enough technical evidence to think that the worst is over for gold prices.
Gold Price Technical Analysis: Weekly Chart (October 2015 to June 2022) (Chart 3)
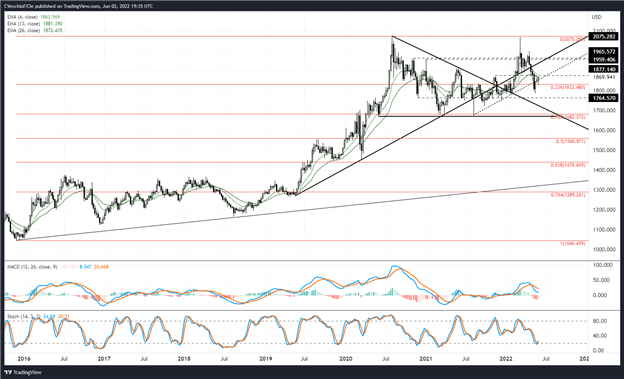
Nothing has changed. “The weekly timeframe continues to suggest that a double top is forming for gold prices, with the two peaks carved out by the August 2020 and March 2022 highs. Ever since the bearish outside engulfing bar on the weekly timeframe in late-April, gold prices have not been able to sustain a meaningful bid.”

IG CLIENT SENTIMENT INDEX: GOLD PRICE FORECAST (June 2, 2022) (Chart 4)
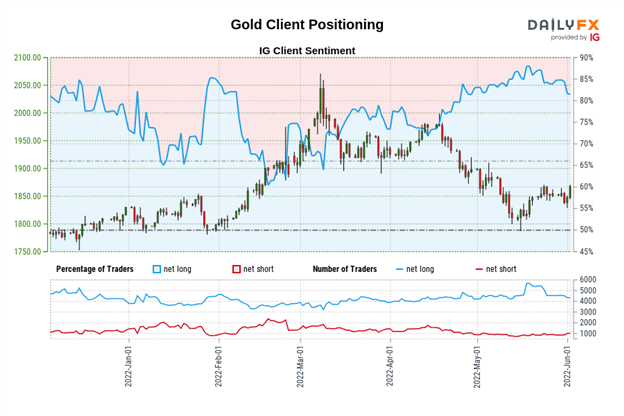
Gold: Retail trader data shows 79.98% of traders are net-long with the ratio of traders long to short at 4.00 to 1. The number of traders net-long is 3.64% lower than yesterday and 8.56% lower from last week, while the number of traders net-short is 4.80% higher than yesterday and 11.13% higher from last week.
We typically take a contrarian view to crowd sentiment, and the fact traders are net-long suggests Gold prices may continue to fall.
Yet traders are less net-long than yesterday and compared with last week. Recent changes in sentiment warn that the current Gold price trend may soon reverse higher despite the fact traders remain net-long.
Trade Smarter - Sign up for the DailyFX Newsletter
Receive timely and compelling market commentary from the DailyFX team
--- Written by Christopher Vecchio, CFA, Senior Strategist


