


Gold Price Outlook:
- Gold prices continue to erode, and a combination of technical patterns and indicators suggest more weakness is ahead.
- Long-end US real rates continue to flirt with a move into positive territory, which have historically been correlated with weaker returns for gold prices.
- According to the IG Client Sentiment Index, gold prices hold a bearish bias in the near-term.

Fundamental Headwinds Remain
Gold prices have been toying with a break below 1900 in recent days, barely a week after attempting to climb above 2000. The ongoing elevation by long-end US real yields – nominal yields less inflation expectations – is serving as a formidable headwind, as is the ongoing surge by the US Dollar (via the DXY Index). As noted last week, “further advances by US real yields will only make the environment more difficult for gold prices, particularly if the geopolitical risk premium embedded in price dissipates if the Russian invasion of Ukraine begins to wind down.”
Gold Volatility Remains Lower, but Correlation with Gold Prices Weakens
Historically, gold prices have a relationship with volatility unlike other asset classes. While other asset classes like bonds and stocks don’t like increased volatility – signaling greater uncertainty around cash flows, dividends, coupon payments, etc. – gold tends to benefit during periods of higher volatility. It thus remains the case that “the continued erosion in gold volatility throughout April has undercut gold prices’ ability to sustain a significant rally, a further drop will make any forthcoming upside attempts feckless.”
GVZ (Gold Volatility) Technical Analysis: Daily Price Chart (April 2021 to April 2022) (Chart 1)

Gold volatility (as measured by the Cboe’s gold volatility ETF, GVZ, which tracks the 1-month implied volatility of gold as derived from the GLD option chain) was trading at 19.03 at the time this report was written. The 5-day correlation between GVZ and gold prices is -0.91 while the 20-day correlation is -0.32. One week ago, on April 19, the 5-day correlation was +0.47 and the 20-day correlation was -0.13.
Gold Price Rate Technical Analysis: Daily Chart (April 2021 to April 2022) (Chart 2)
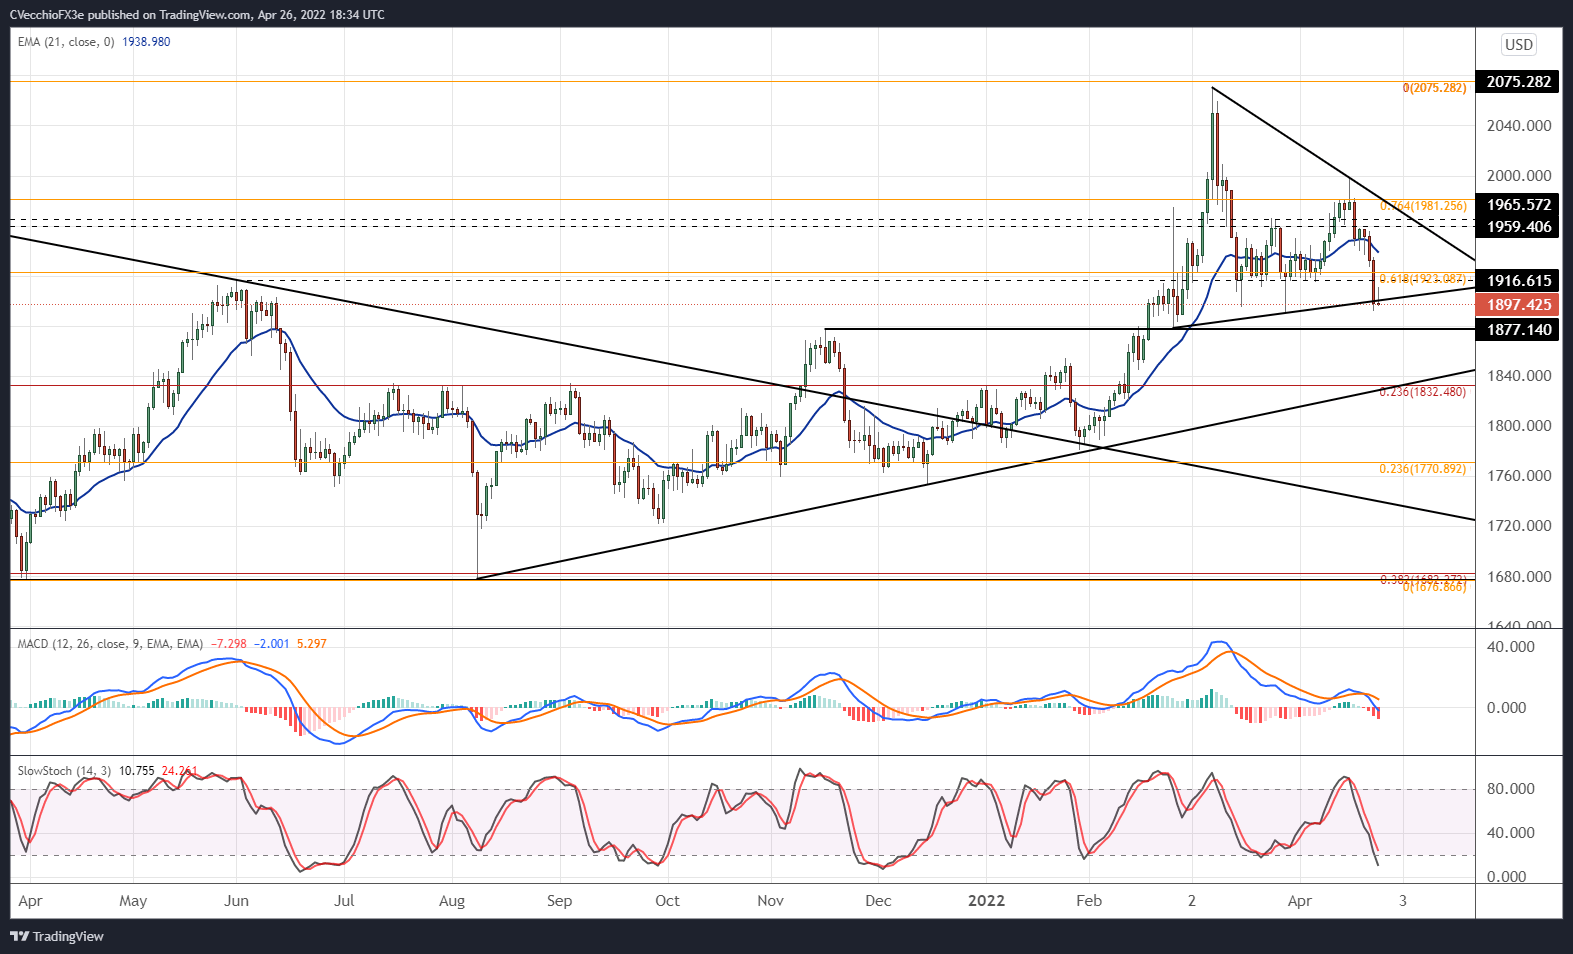
Gold prices have dropped below the confluence of resistance carved out at the November 2020 and January 2021 highs between 1959.41 and 1965.57, holding around 1900 in the first half of this week. The rising trendline from the late-February and late-March swing lows, support in a symmetrical triangle, appears to be breaking as well.
Bearish momentum is gathering pace. Gold prices are below their daily 5-, 8-, 13-, and 21-EMAs, and the daily EMA envelope is in bearish sequential order. Daily MACD issued a sell signal and is now below its signal line), while daily Slow Stochastics have entered oversold territory. A further drop towards the November 2021 swing high below 1880 appears like the next stop lower.
Gold Price Technical Analysis: Weekly Chart (October 2015 to April 2022) (Chart 3)

The weekly timeframe still showcases the potential for a clear double top in gold prices, formed by the August 2020 and March 2022 highs. Last week’s drop below the highs from November 2020 and January 2021 around 1959/1965 hint that a false bullish break higher has transpired, with the bearish outside engulfing bar on the weekly timeframe reinforcing this point of view. A deeper setback appears increasingly likely henceforth.

IG CLIENT SENTIMENT INDEX: GOLD PRICE FORECAST (April 26, 2022) (Chart 4)
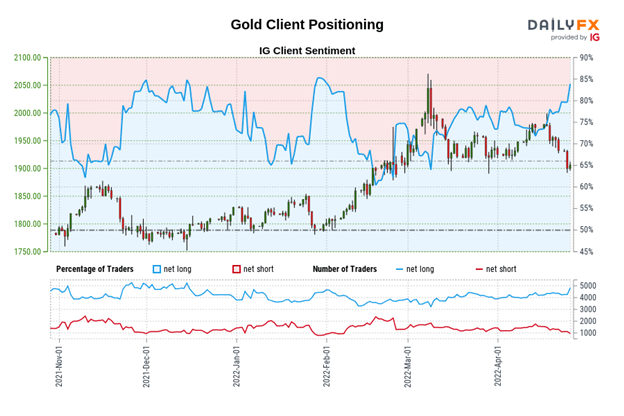
Gold: Retail trader data shows 82.45% of traders are net-long with the ratio of traders long to short at 4.70 to 1. The number of traders net-long is 7.30% higher than yesterday and 10.42% higher from last week, while the number of traders net-short is 2.31% higher than yesterday and 23.77% lower from last week.
We typically take a contrarian view to crowd sentiment, and the fact traders are net-long suggests Gold prices may continue to fall.
Traders are further net-long than yesterday and last week, and the combination of current sentiment and recent changes gives us a stronger Gold-bearish contrarian trading bias.
--- Written by Christopher Vecchio, CFA, Senior Strategist


