


Gold Price Outlook:
- Gold prices are plodding along below symmetrical triangle support, with momentum indicators starting to point lower.
- Only by clearing 1785 in the coming days would traders have a substantive reason to look long gold prices; otherwise, selling the rally may be the modus operandi henceforth.
- According to the IG Client Sentiment Index, gold prices have a neutral bias in the near-term.

A Dead Cat Bounce?
Last week it was noted that “it’s increasingly looking like the only bullish catalyst gold prices will have in the near-term is a potential breach of the US debt ceiling a la 2011 or a meltdown by China’s Evergrande, but beyond that, there’s little for gold to hang its hat on.”
The news around Chinese property developed Evergrande has undercut risk appetite in global financial markets, resuscitating beleaguered precious metals like gold. But the countertrend rally in gold prices this week lacks teeth, insofar as no significant technical resistance levels – primarily former support in a variety of ways – have been cleared out.
It may be the case that what’s happening in gold prices is nothing more than a ‘dead cat bounce,’ as financial markets are getting ready to content with the September Fed meeting results tomorrow afternoon. In recent Fed meetings and moreover, minutes from those Fed meetings, gold prices haven’t fared well as US policymakers inch ever-closer towards making a stimulus taper announcement.
Gold Volatility and Gold Prices’ Abnormal Relationship
Historically, gold prices have a relationship with volatility unlike other asset classes. While other asset classes like bonds and stocks don’t like increased volatility – signaling greater uncertainty around cash flows, dividends, coupon payments, etc. – gold tends to benefit during periods of higher volatility. Falling gold volatility and weak correlations suggests continued difficult trading may be ahead for gold prices.
GVZ (Gold Volatility) Technical Analysis: Daily Price Chart (September 2020 to September 2021) (Chart 1)
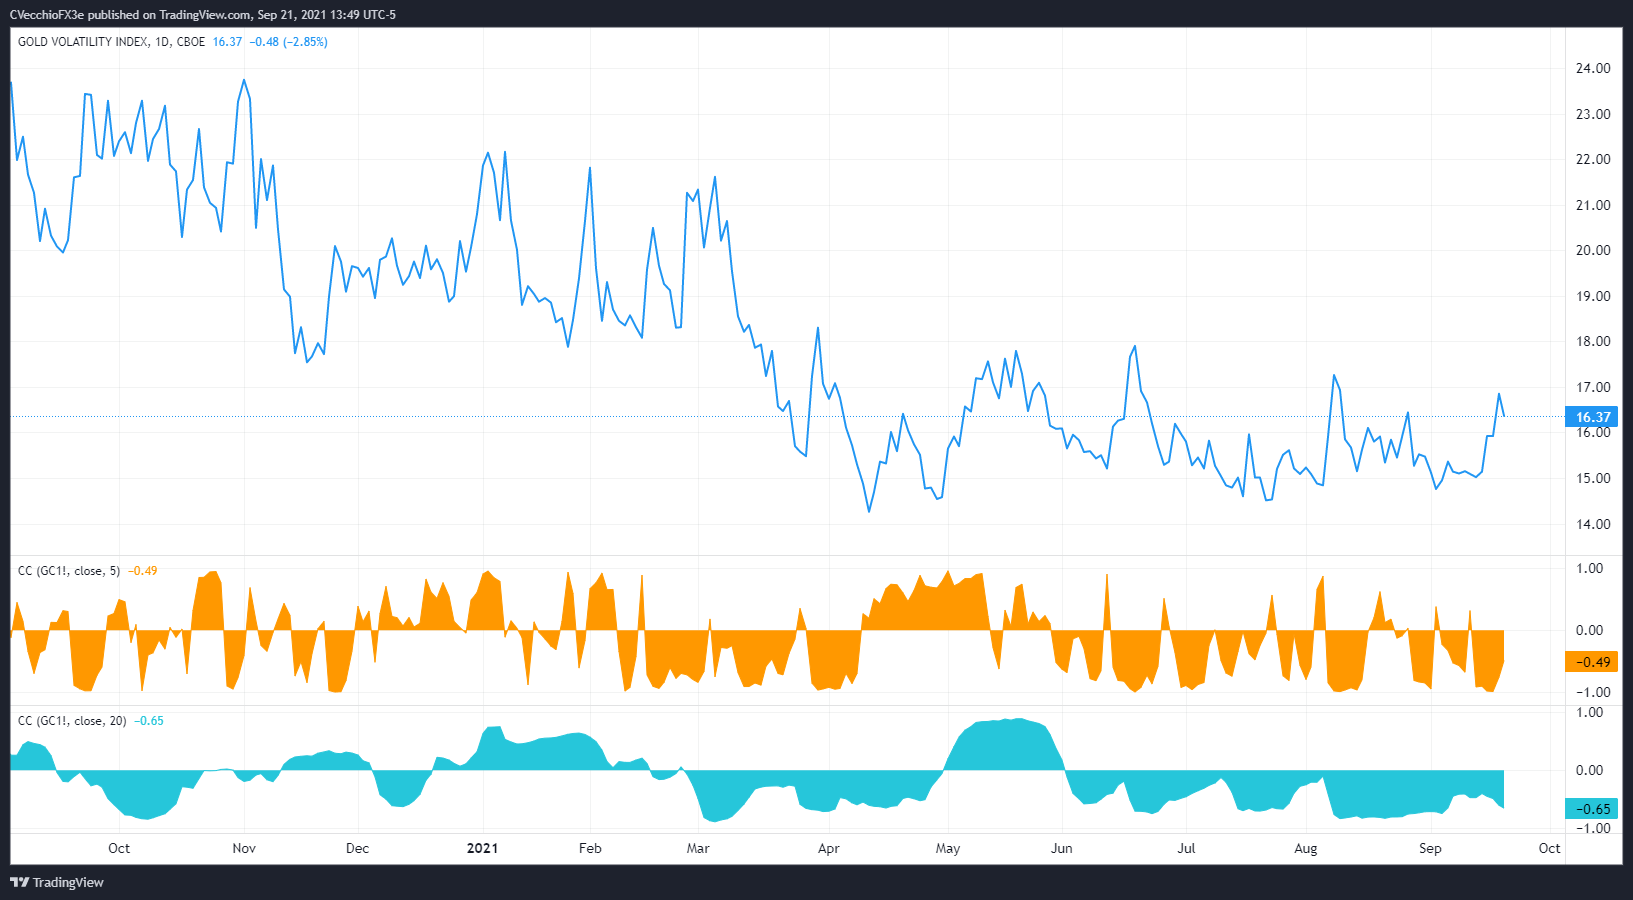
Gold volatility (as measured by the Cboe’s gold volatility ETF, GVZ, which tracks the 1-month implied volatility of gold as derived from the GLD option chain) was trading at 16.37. The relationship between gold prices and gold volatility remains abnormal. The 5-day correlation between GVZ and gold prices is -0.49 while the 20-day correlation is -0.65. One week ago, on September 14, the 5-day correlation was -0.92 and the 20-day correlation was -0.47.
Gold Price Rate Technical Analysis: Daily Chart (August 2020 to September 2021) (Chart 2)
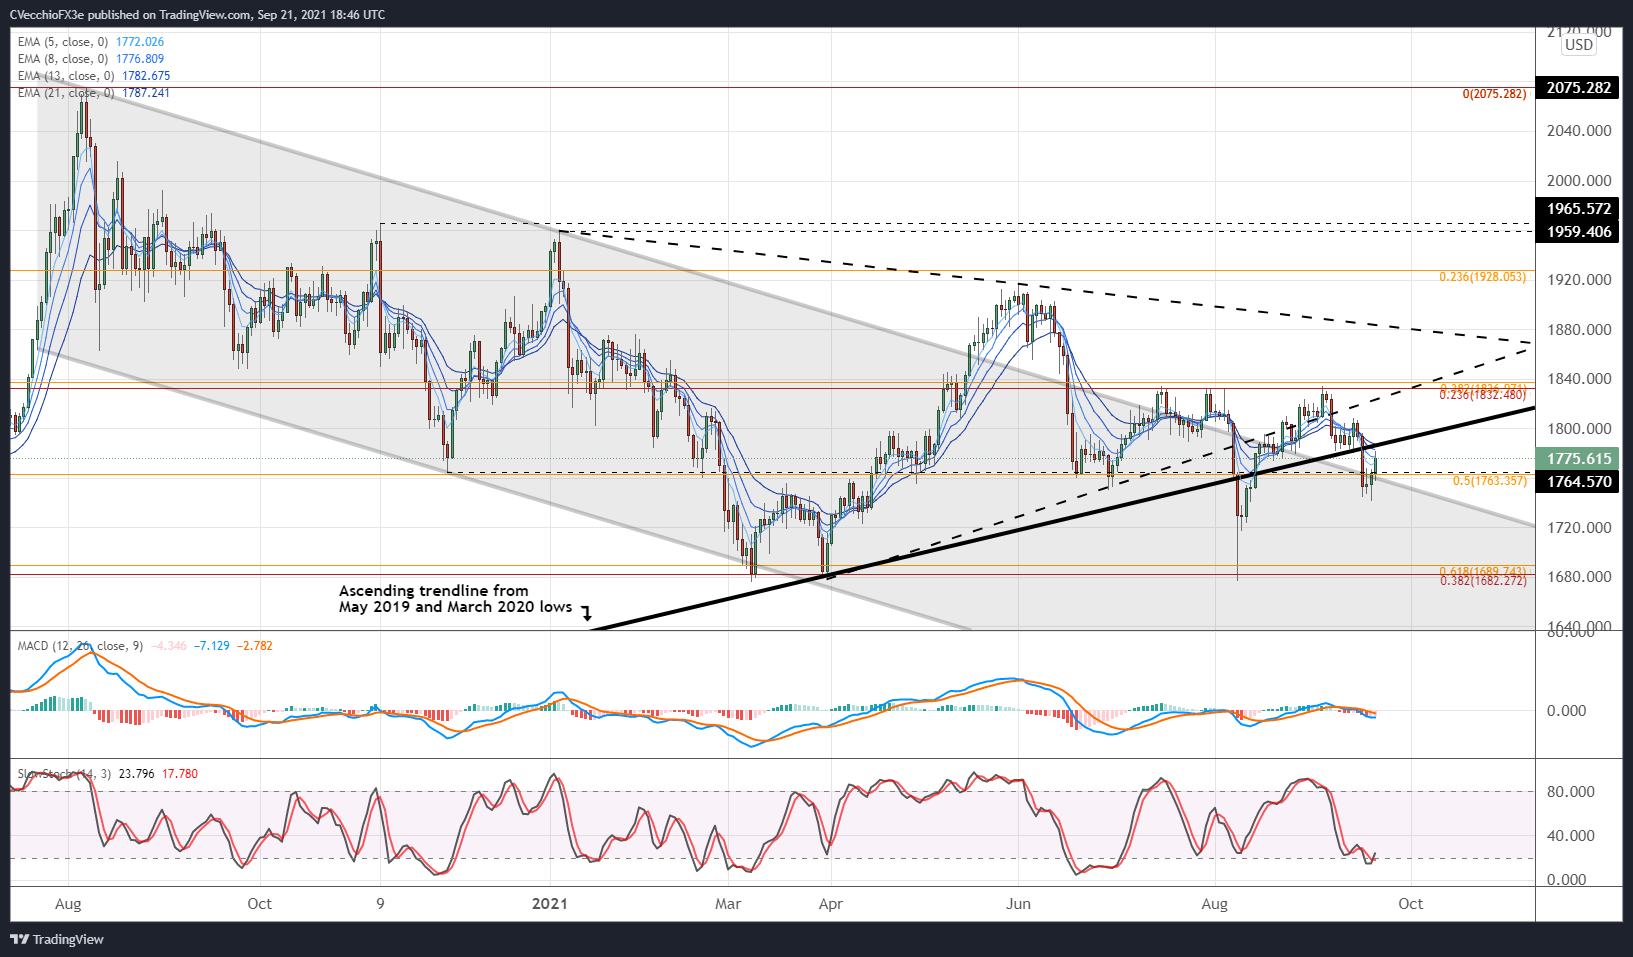
Last week it was noted that “bigger picture, failure to overcome the July highs – clearing the 1835 level discussed ad nauseum over the past six weeks – suggests that the pair has bearish technical inclinations in the near-term.” Yesterday, gold prices hit a fresh monthly low just above 1742.
The countertrend move over the past 24-hours may present a selling opportunity in gold prices lest a further breakdown in risk appetite transpire. Gold prices remain below their daily 5-, 8-, 13-, and 21-EMA envelope, which is in bearish sequential order. Daily MACD has falling while below its signal line, and daily Slow Stochastics are lingering in oversold territory.
Even though a rebound has transpired over the past 24-hours, gold prices remain below former support in the symmetrical triangle that encompassed price action from January through July, and more recently have traded below the ascending trendline from the May 2019, March 2020, and March 2021 lows. Further weakness cannot be ruled out at this time.
Gold Price Technical Analysis: Weekly Chart (October 2015 to September 2021) (Chart 3)

Gold prices’ technical structure on the weekly timeframe has eroded over the past several days. The weekly 4-, 13-, and 26-EMA envelope is tilting lower, while weekly MACD has started to slip below its signal line. Even weekly Slow Stochastics have started to turn lower near their median line. Only by clearing 1785 in the coming days would traders have a substantive reason to look long gold prices; otherwise, selling the rally may be the modus operandi henceforth.

IG CLIENT SENTIMENT INDEX: GOLD PRICE FORECAST (September 21, 2021) (CHART 4)

Gold: Retail trader data shows 80.78% of traders are net-long with the ratio of traders long to short at 4.20 to 1. The number of traders net-long is 3.21% lower than yesterday and 13.37% higher from last week, while the number of traders net-short is 1.86% lower than yesterday and 1.61% higher from last week.
We typically take a contrarian view to crowd sentiment, and the fact traders are net-long suggests Gold prices may continue to fall.
Positioning is less net-long than yesterday but more net-long from last week. The combination of current sentiment and recent changes gives us a further mixed Gold trading bias.
--- Written by Christopher Vecchio, CFA, Senior Strategist


