


Gold Price Outlook:
- Gold prices have staged a modest recovery over the past week, but remain deep in ‘the technical woods.’
- With a cluster of Fibonacci levels above, it would appear that gold prices aren’t out of ‘the technical woods’ until 1835 is achieved.
- According to the IG Client Sentiment Index, gold prices have a bullish bias in the near-term.
Questions Remain
Gold prices have enjoyed a small but consistent rally at the start of July, consistent with recent seasonality trends that peg gold for having one of its best months of the year. Fueled by falling US real yields in recent days – the slump in long-end US Treasury yields has outpaced the decline in inflation expectations – gold prices find themselves attempting to ‘turn the corner,’ technically speaking.
Technical gauges of momentum have indeed started to turn higher, but questions remain. As the saying goes, ‘more wood needs to be chopped’ before gold prices exit ‘the technical woods.’

Gold Volatility and Gold Prices Tracking Closely
Historically, gold prices have a relationship with volatility unlike other asset classes. While other asset classes like bonds and stocks don’t like increased volatility – signaling greater uncertainty around cash flows, dividends, coupon payments, etc. – gold tends to benefit during periods of higher volatility.
GVZ (Gold Volatility) Technical Analysis: Daily Price Chart (July 2020 to July 2021) (Chart 1)
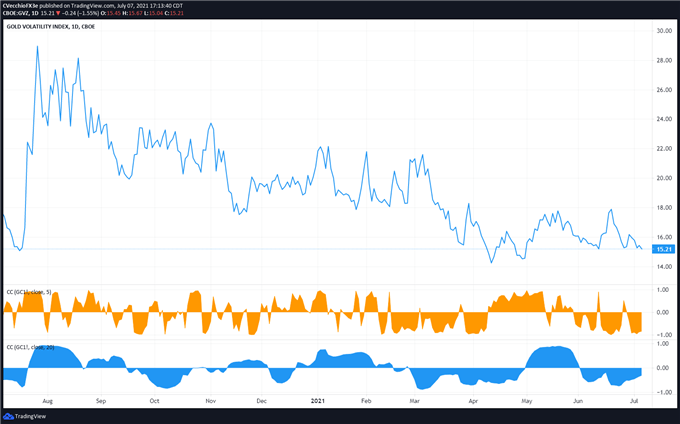
Gold volatility (as measured by the Cboe’s gold volatility ETF, GVZ, which tracks the 1-month implied volatility of gold as derived from the GLD option chain) was trading at 15.21. The relationship between gold prices and gold volatility is both ‘normal’ in recent days but has been eroding on a longer time horizon. The 5-day correlation between GVZ and gold prices is -0.84 while the 20-day correlation is -0.31. One week ago, on June 30, the 5-day correlation was -0.92 and the 20-day correlation was -0.48.
Gold Price Rate Technical Analysis: Daily Chart (March 2020 to July 2021) (Chart 2)
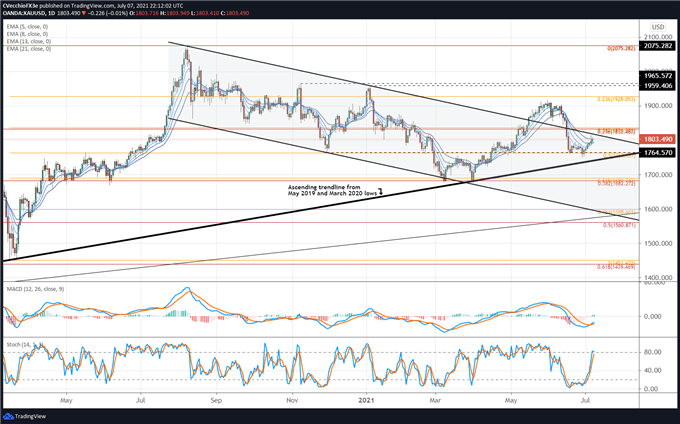
Gold prices have seen a modest rebound over the past week as US Treasury yields have pulled back. But the technical picture remains muddied at best. Last week gold prices found support ahead of the ascending trendline from the May 2019, March 2020, and March 2021 lows, rebounding at the 50% Fibonacci retracement of the 2020 high/low move at 1763.57. However, gold prices still remain within the descending channel measured against the August 2020 and January 2021 swing highs. With a cluster of Fibonacci levels above, it would appear that gold prices aren’t out of ‘the technical woods’ until 1835 is achieved.
Gold Price Technical Analysis: Weekly Chart (October 2015 to July 2021) (Chart 3)
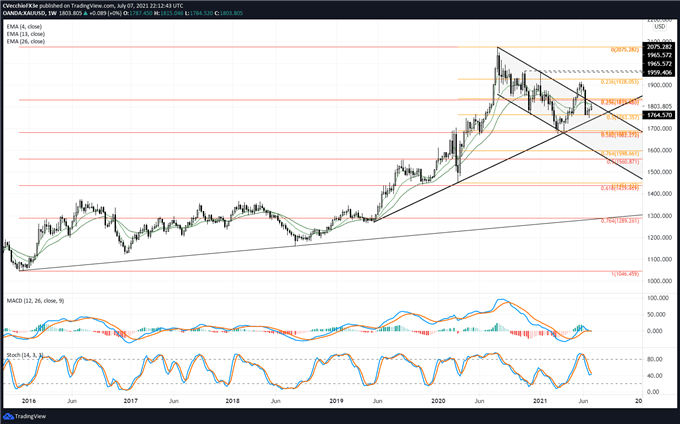
As noted in mid-June, “it is now no longer applicable to apply a longer-term bullish view on gold prices; the outlook is decidedly neutral at present time. The threat of a more significant breakdown looms, and without more progression back above the descending trendline from the August 2020 and January 2021 highs, then it stands to reason that the technical structure is unfavorable.”

IG CLIENT SENTIMENT INDEX: GOLD PRICE FORECAST (July 7, 2021) (CHART 4)
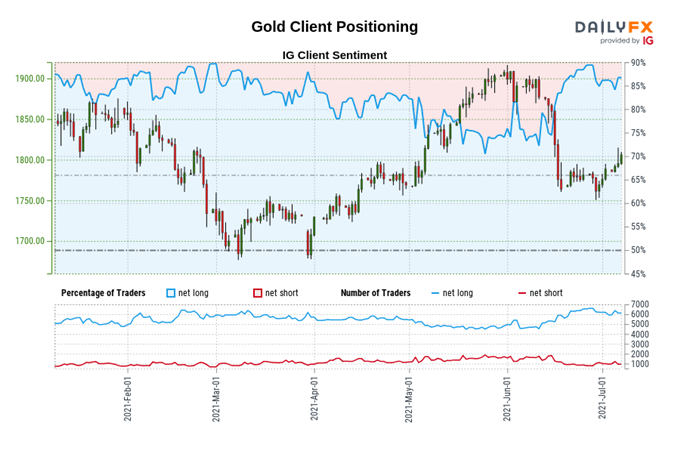
Gold: Retail trader data shows 84.79% of traders are net-long with the ratio of traders long to short at 5.57 to 1. The number of traders net-long is 1.61% higher than yesterday and 1.47% lower from last week, while the number of traders net-short is 15.96% higher than yesterday and 1.86% higher from last week.
We typically take a contrarian view to crowd sentiment, and the fact traders are net-long suggests Gold prices may continue to fall.
Yet traders are less net-long than yesterday and compared with last week. Recent changes in sentiment warn that the current Gold price trend may soon reverse higher despite the fact traders remain net-long.
--- Written by Christopher Vecchio, CFA, Senior Currency Strategist


