


Gold Price Outlook:
- Gold prices haven’t been able to stage a significant recovery after their steep drop post-Fed.
- Support has been found around the 50% Fibonacci retracement of the 2020 high/low move, which may prove to be a significant level of interest as the calendar turns to a new month, a new quarter, and the second half of the year.
- According to the IG Client Sentiment Index, gold prices have a bullish bias in the near-term.
Not Much to Like Right Now
Last week, in the wake of the June Federal Reserve policy meeting, it was noted that “gold prices have since entered a window of time where US real yields have begun to rise. Shifts in the US Treasury yield curve, on balance, suggesting a period with stronger short- and intermediate-term rates, has been consistent with a stronger US Dollar. As things stand now, it’s once again an uphill climb for gold prices as investors seeking higher yielding and more growth-sensitive assets.”
Since then, gold prices have hit a fresh monthly low, while the US Dollar has continued to rally and US equity markets have reached fresh record highs. In a sense, nothing has changed for gold (or markets generally) one way or the other. It may be the case that the best outcome for gold prices is if the COVID-19 delta variant becomes a ‘wall of worry’ for markets to climb, an excuse for stimulus to keep flowing in an otherwise growing economy.

Gold Volatility and Gold Prices Back in Sync
Historically, gold prices have a relationship with volatility unlike other asset classes. While other asset classes like bonds and stocks don’t like increased volatility – signaling greater uncertainty around cash flows, dividends, coupon payments, etc. – gold tends to benefit during periods of higher volatility.
GVZ (Gold Volatility) Technical Analysis: Daily Price Chart (June 2020 to June 2021) (Chart 1)
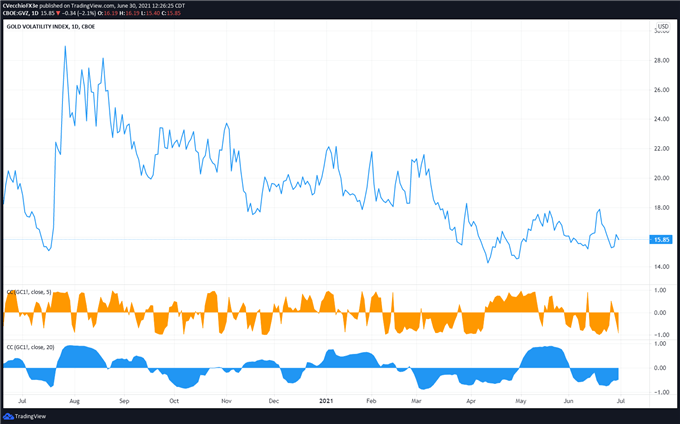
Gold volatility (as measured by the Cboe’s gold volatility ETF, GVZ, which tracks the 1-month implied volatility of gold as derived from the GLD option chain) was trading at 15.85. Last week it was noted “with the relationship between gold prices and gold volatility still out of sync, questions remain about gold price’s ability to sustain a significant rebound.” Gold prices hit a fresh monthly low yesterday.
However, the relationship is starting to stabilize again. Now, the 5-day correlation between GVZ and gold prices is -0.93 while the 20-day correlation is -0.47. One week ago, on June 23, the 5-day correlation was -0.86 and the 20-day correlation was -0.75.
Gold Price Rate Technical Analysis: Daily Chart (March 2020 to June 2021) (Chart 2)
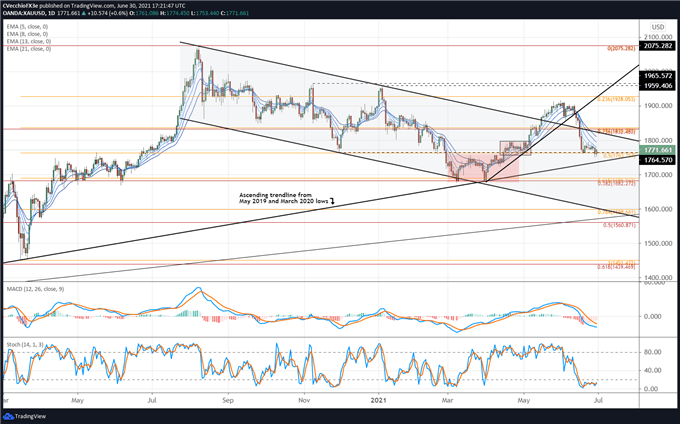
Gold prices haven’t done much over the past week aside from hitting a fresh monthly low, but stability has prevailed as the month, quarter, and first half of the year come to a close. Gold prices remain within the descending channel measured against the August 2020 and January 2021 swing highs. Support remains around the 50% Fibonacci retracement of the 2020 high/low move at 1763.57. Failure here at the start of July would suggest a deeper pullback towards 1740 by the end of the month (where time meets the rising trendline from the May 2019 and March 2020 swing lows).
Gold Price Technical Analysis: Weekly Chart (October 2015 to June 2021) (Chart 3)
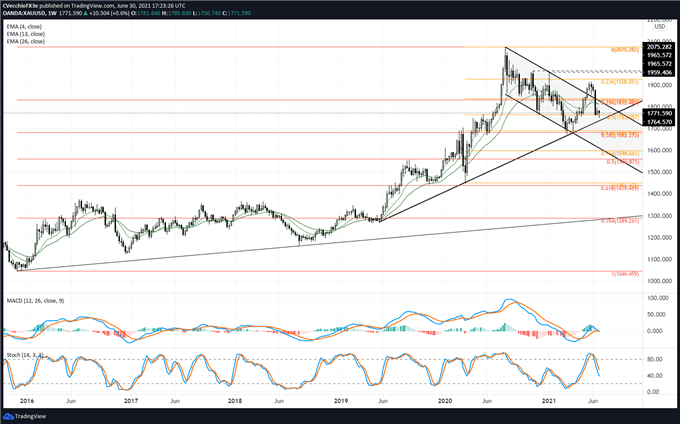
As noted last week, it is now no longer applicable to apply a longer-term bullish view on gold prices; the outlook is decidedly neutral at present time. The threat of a more significant breakdown looms, and without more progression back above the descending trendline from the August 2020 and January 2021 highs, then it stands to reason that the technical structure is unfavorable.

IG CLIENT SENTIMENT INDEX: GOLD PRICE FORECAST (June 30, 2021) (CHART 4)
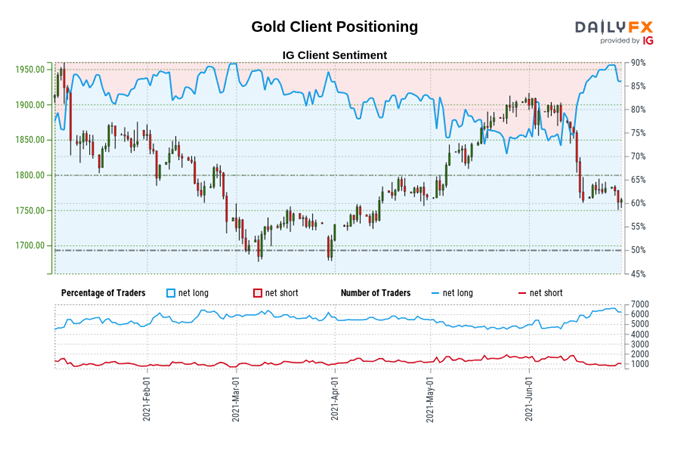
Gold: Retail trader data shows 84.26% of traders are net-long with the ratio of traders long to short at 5.35 to 1. The number of traders net-long is 0.11% lower than yesterday and 2.53% lower from last week, while the number of traders net-short is 20.02% higher than yesterday and 26.89% higher from last week.
We typically take a contrarian view to crowd sentiment, and the fact traders are net-long suggests Gold prices may continue to fall.
Yet traders are less net-long than yesterday and compared with last week. Recent changes in sentiment warn that the current Gold price trend may soon reverse higher despite the fact traders remain net-long.
--- Written by Christopher Vecchio, CFA, Senior Currency Strategist


