


Gold Price Outlook:
- The shiny metal rockdoesn’t offer a coupon, dividend, or cash flow. Comparatively speaking, this leaves gold at a disadvantage in an environment defined by appealing growth prospects and rising real yields (returns in excess of inflation).
- Gold prices are struggling to climb back above the downtrend from the January and February swing highs, and in turn, have not yet reclaimed the rising trendline from the March and November 2020 lows – the pandemic uptrend.
- According to the IG Client Sentiment Index, gold prices have a bullish bias.
Gold Prices Stuck in Downtrend
Gold prices can’t seem to catch a break. The worst performing metal, precious or otherwise, gold lacks the economic appeal that copper or silver brings to the table.Comparatively speaking, this leaves gold at a disadvantage in an environment defined by appealing growth prospects and rising real yields (returns in excess of inflation).
Yields are, in effect, the tail that wags the dog. Rising interest rates change valuation considerations and thus asset allocation preferences. If gold is supposed to serve as a hedge against inflation – and inflation expectations are at multi-year highs in the UK and US, for example – it fails to fulfill this role most efficiently when investors believe that there are other assets that offer better potential return (like, US Treasuries, or, say, Bitcoin).

Gold Prices, Gold Volatility Out of Sync
Historically, gold prices have a relationship with volatility unlike other asset classes. While other asset classes like bonds and stocks don’t like increased volatility – signaling greater uncertainty around cash flows, dividends, coupon payments, etc. – gold tends to benefit during periods of higher volatility.
GVZ (Gold Volatility) Technical Analysis: Daily Price Chart (February 2020 to February 2021) (Chart 1)
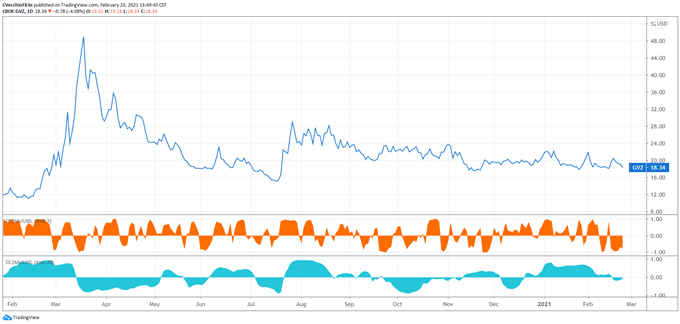
Gold volatility has dropped in recent days, but has more or less been rangebound for the better part of the last four months. Gold volatility (as measured by the Cboe’s gold volatility ETF, GVZ, which tracks the 1-month implied volatility of gold as derived from the GLD option chain) is trading at 18.34, well-off the yearly high set during the first week of February at 24.03.
The 5-day correlation between GVZ and gold prices is -0.77 while the 20-day correlation is -0.06; one week ago, on February 16, the 5-day correlation was -0.75 and the 20-day correlation was +0.09.
A Reminder on the Long-term Fundamentals
The longer-term fiscal stimulus impulse in the context of a low interest rate environment should be beneficial for gold prices (akin to the 2009-2011 period) – it’s that simple from my point of view. With US President Joe Biden pushing for his full $1.9 trillion fiscal stimulus package, and Senate Democrats having the ability to pass significant portions of his plan into law vis-à-vis budget reconciliation, the fiscal impulse that helped gold prices in 2020 may soon return in 2021.
Gold Price Rate Technical Analysis: Daily Chart (February 2020 to February 2021) (Chart 2)

Gold prices have bounced from the 50% Fibonacci retracement of the 2020 low/high range, but have not yet cleared a confluence of technical levels that are proving to be formidable support. The market has thus far been constrained by the descending trendline from the January and February highs, the intrayearly downtrend. They’re also trading below the 23.6% Fibonacci retracement of the 2015 low/2020 high range at 1832.48, as well as the 38.2% Fibonacci retracement of the 2020 low/high range at 1836.97. This area has served as resistance throughout February.
Gold prices are intertwined with the daily 5-, 8-, 13-, and 21-EMA envelope, which remains in in bearish sequential order. Daily MACD’s drop in bearish territory is turning around, and daily Slow Stochastics have already returned to their median line. Signs are clear that momentum is turning more bullish, but until price action provides resolution above the aforementioned confluence of technical levels serving as resistance, gold’s nascent bullish momentum may run out of steam.
Gold Price Technical Analysis: Weekly Chart (October 2015 to February 2021) (Chart 3)

In prior outlooks it has been noted that “breaking the downtrend from the August and November 2020 highs as well as the 38.2% Fibonacci retracement from the 2020 high/low range suggests that the next leg higher is beginning. A move higher through 1965.57 would suggest that the series of weekly ‘lower highs and lower lows’ has ended. A drop below 1840…would suggest that the uptrend from the March and November 2020 low has been broken, suggesting a deeper setback towards 1764.57 (November 2020 low) would be possible.”
Technically speaking, further downside from here (below the 50% Fibonacci retracement of the 2020 low/high range) would warrant a reconsideration the 1Q’21 forecast, which suggests that gold prices could hit new highs this quarter.

IG CLIENT SENTIMENT INDEX: GOLD PRICE FORECAST (February 23, 2021) (CHART 4)
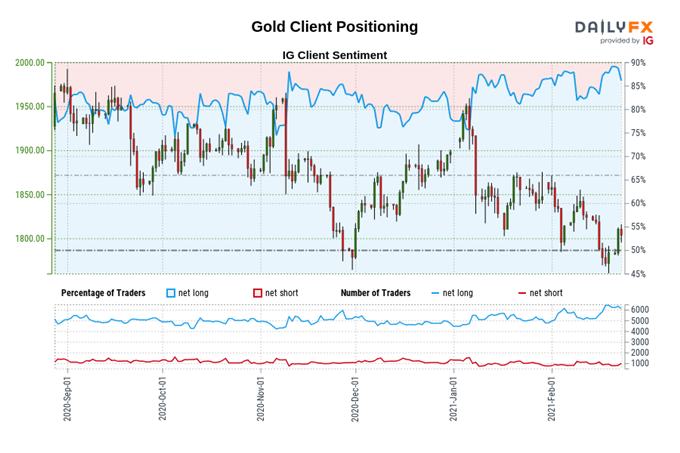
Gold: Retail trader data shows 83.60% of traders are net-long with the ratio of traders long to short at 5.10 to 1. The number of traders net-long is 12.11% lower than yesterday and 2.03% lower from last week, while the number of traders net-short is 18.45% higher than yesterday and 20.66% higher from last week.
We typically take a contrarian view to crowd sentiment, and the fact traders are net-long suggests Gold prices may continue to fall.
Yet traders are less net-long than yesterday and compared with last week. Recent changes in sentiment warn that the current Gold price trend may soon reverse higher despite the fact traders remain net-long.
--- Written by Christopher Vecchio, CFA, Senior Currency Strategist


