


Gold Price Outlook:
- Gold prices have rallied sharply in recent days, but they’re not in the clear just yet.
- Gold prices are struggling to climb back above their daily 5-, 8-, 13-, and 21-EMA envelope, which remains in bearish sequential order.
- According to the IG Client Sentiment Index, gold prices have a mixed bias.
Gold Prices Bounce, but is it Believable?
Gold prices lost key technical support last week, but bulls aren’t ready to throw in the towel just yet. With US President Joe Biden’s $1.9 trillion fiscal stimulus plan moving closer to fruition, precious metals have been bid higher as the entrenched regime of low interest rates and climbing deficits and debts doesn’t appear to be going anywhere. But even as gold prices have rallied sharply in the past few days, bullion is not in the clear just yet. Testing the backside of former support (now resistance), gold prices are at a potential make-or-break level that will discern whether or not the recent bounce is believable.

Gold Prices and Volatility Relationship Slips
Historically, gold prices have a relationship with volatility unlike other asset classes. While other asset classes like bonds and stocks don’t like increased volatility – signaling greater uncertainty around cash flows, dividends, coupon payments, etc. – gold tends to benefit during periods of higher volatility.
GVZ (Gold Volatility) Technical Analysis: Daily Price Chart (February 2020 to February 2021) (Chart 1)
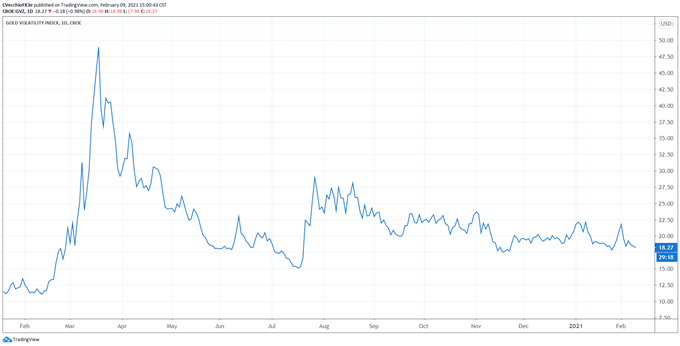
Gold volatility has fallen in recent days, but gold prices have otherwise rallied. Gold volatility (as measured by the Cboe’s gold volatility ETF, GVZ, which tracks the 1-month implied volatility of gold as derived from the GLD option chain) is trading at 18.27, well-off the yearly high set last week at 24.03. The 5-day correlation between GVZ and gold prices is -0.98 while the 20-day correlation is +0.16; one week ago, on February 9, the 5-day correlation was +0.81 and the 20-day correlation was +0.54.
A Reminder on the Long-term Fundamentals
The longer-term fiscal stimulus impulse in the context of a low interest rate environment should be beneficial for gold prices (akin to the 2009-2011 period) – it’s that simple from my point of view. With US President Joe Biden pushing for his full $1.9 trillion fiscal stimulus package, and Senate Democrats having the ability to pass significant portions of his plan into law vis-à-vis budget reconciliation, the fiscal impulse that helped gold prices in 2020 may soon return in 2021.
Gold Price Rate Technical Analysis: Daily Chart (February 2020 to February 2021) (Chart 2)
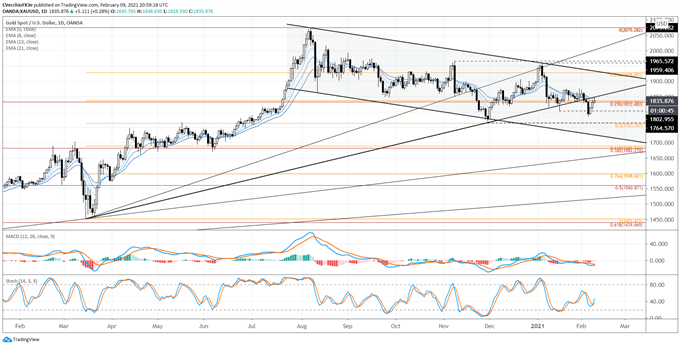
Gold prices are back to a familiar area, the 23.6% Fibonacci retracement of the 2015 low/2020 high range at 1832.48, as well as the 38.2% Fibonacci retracement of the 2020 low/high range at 1836.97. But this time is different than the last visit at the end of January: instead of support, this area is now resistance. Likewise, gold prices are finding former support in the form of the rising trendline from the March and November 2020 lows as resistance. Gold prices remain below their daily 5-, 8-, 13-, and 21-EMA envelope, which is still in bearish sequential order. Daily MACD’s drop in bearish territory has halted, and daily Slow Stochastics are rising through their median line.
Gold Price Technical Analysis: Weekly Chart (October 2015 to February 2021) (Chart 3)
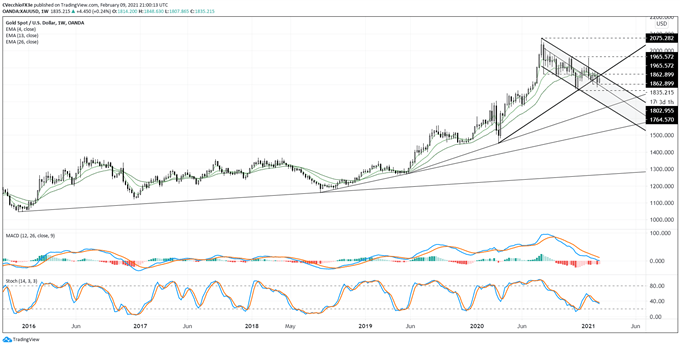
In prior outlooks it has been noted that “breaking the downtrend from the August and November 2020 highs as well as the 38.2% Fibonacci retracement from the 2020 high/low range suggests that the next leg higher is beginning. A move higher through 1965.57 would suggest that the series of weekly ‘lower highs and lower lows’ has ended. A drop below 1840…would suggest that the uptrend from the March and November 2020 low has been broken, suggesting a deeper setback towards 1764.57 (November 2020 low) would be possible.” This setback occurred, but now the fight to get back above the pandemic uptrend will very likely determine the next directional bias.
Technically speaking, further downside from here would warrant a reconsideration the 1Q’21 forecast, which suggests that gold prices could hit new highs this quarter.

IG CLIENT SENTIMENT INDEX: GOLD PRICE FORECAST (February 9, 2021) (CHART 4)
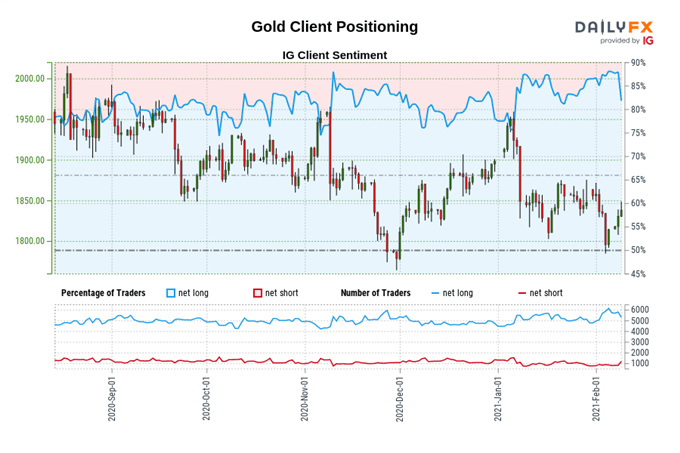
Gold: Retail trader data shows 82.07% of traders are net-long with the ratio of traders long to short at 4.58 to 1. The number of traders net-long is 1.52% lower than yesterday and 6.59% lower from last week, while the number of traders net-short is 8.85% lower than yesterday and 31.29% higher from last week.
We typically take a contrarian view to crowd sentiment, and the fact traders are net-long suggests Gold prices may continue to fall.
Positioning is more net-long than yesterday but less net-long from last week. The combination of current sentiment and recent changes gives us a further mixed Gold trading bias.
--- Written by Christopher Vecchio, CFA, Senior Currency Strategist


