


Gold Price Outlook:
- Gold prices have followed silver prices lower as the day trading frenzy has hit rough waters.
- Gold prices are fully below their daily 5-, 8-, 13-, and 21-EMA envelope, holding in bearish sequential order.
- According to the IG Client Sentiment Index, gold prices have a bearish bias.
Gold Prices Mirror Silver’s Fall
Gold prices may not have proven as volatile as their precious metal brethren, silver, but as is often the case, the precious metals complex moves synchronously. The plunge in silver prices (see: Silver Price Forecast: The Next GameStop? Levels for XAG/USD) is not a surprise, given the efforts by institutional finance to reassert control over the narrative in markets; silver is not GameStop, after all. But as the air comes out of this very short-term media-hyped bubble – the bump in silver prices lasted all but three days – gold prices remain vulnerable to further downside, particularly as key technical levels come under pressure.

Gold Prices and Gold Volatility Relationship Strong
Historically, gold prices have a relationship with volatility unlike other asset classes. While other asset classes like bonds and stocks don’t like increased volatility – signaling greater uncertainty around cash flows, dividends, coupon payments, etc. – gold tends to benefit during periods of higher volatility.
GVZ (Gold Volatility) Technical Analysis: Daily Price Chart (February 2020 to February 2021) (Chart 1)
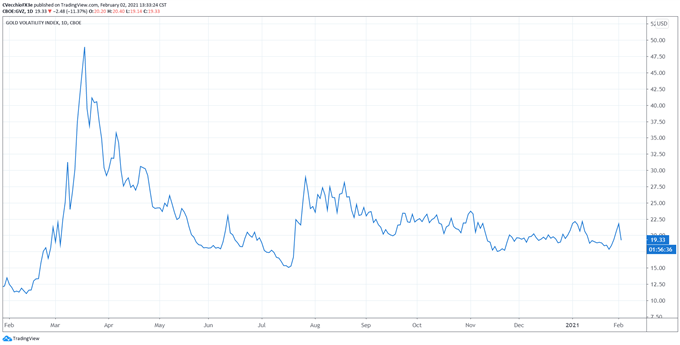
Gold volatility has fallen in recent days, dragging down gold prices. Gold volatility (as measured by the Cboe’s gold volatility ETF, GVZ, which tracks the 1-month implied volatility of gold as derived from the GLD option chain) is trading at 19.33, well-off the high set yesterday at 24.03. The 5-day correlation between GVZ and gold prices is +0.83 while the 20-day correlation is +0.54; one week ago, on January 25, the 5-day correlation was +0.93 and the 20-day correlation was +0.67.
A Reminder on the Long-term Fundamentals
The longer-term fiscal stimulus impulse in the context of a low interest rate environment should be beneficial for gold prices (akin to the 2009-2011 period) – it’s that simple from my point of view. With US President Joe Biden pushing for his full $1.9 trillion fiscal stimulus package, and Senate Democrats having the ability to pass significant portions of his plan into law vis-à-vis budget reconciliation, the fiscal impulse that helped gold prices in 2020 may soon return in 2021.
Gold Price Rate Technical Analysis: Daily Chart (February 2020 to February 2021) (Chart 2)
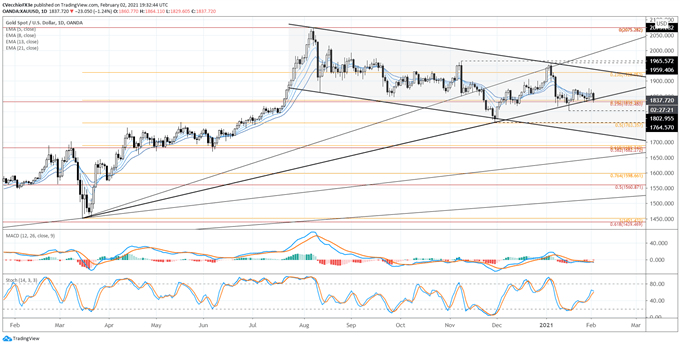
Redrawing the descending channel, gold prices remain both the descending trendline from the August 2020 and January 2021 highs, as well as the August and November 2020 descending trendline. Once more, however, gold prices are dancing along a familiar support area, the 23.6% Fibonacci retracement of the 2015 low/2020 high range at 1832.48, as well as the 38.2% Fibonacci retracement of the 2020 low/high range at 1836.97. As noted previously, “failure below these levels opens up a quick drop back to the yearly low towards 1802.96. Gold prices are fully below their daily 5-, 8-, 13-, and 21-EMA envelope, which is now in bearish sequential order. Daily MACD is trending lower below its signal line, while daily Slow Stochastics are neutral.” Momentum remains bearish.
Gold Price Technical Analysis: Weekly Chart (October 2015 to February 2021) (Chart 3)
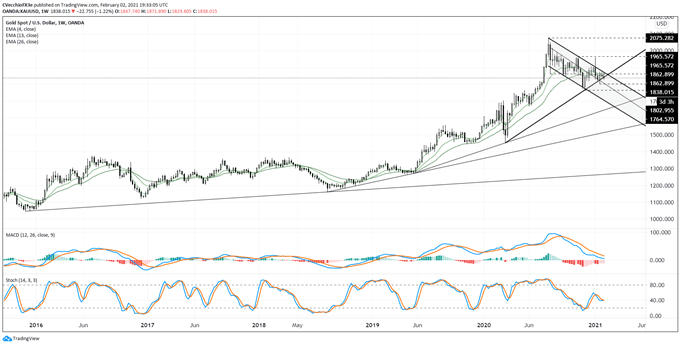
In prior outlooks it has been noted that “breaking the downtrend from the August and November 2020 highs as well as the 38.2% Fibonacci retracement from the 2020 high/low range suggests that the next leg higher is beginning. A move higher through 1965.57 would suggest that the series of weekly ‘lower highs and lower lows’ has ended.” A drop below 1840 by the end of the week would suggest that the uptrend from the March and November 2020 low has been broken, suggesting a deeper setback towards 1764.57 (November 2020 low) would be possible.
Technically speaking, further downside from here would warrant a reconsideration the 1Q’21 forecast, which suggests that gold prices could hit new highs this quarter.

IG CLIENT SENTIMENT INDEX: GOLD PRICE FORECAST (February 2, 2021) (CHART 4)
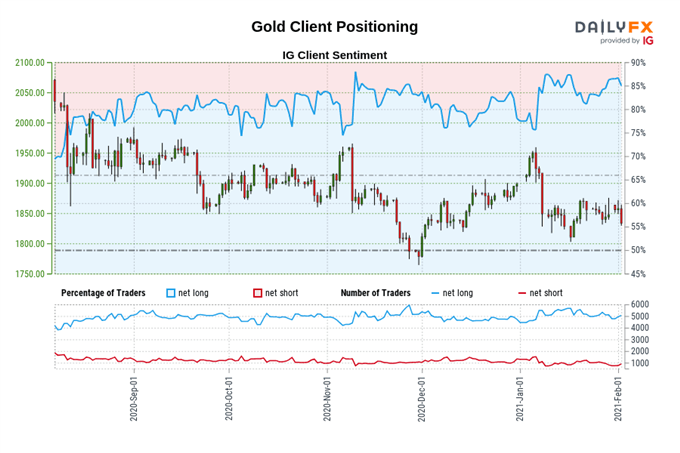
Gold: Retail trader data shows 86.81% of traders are net-long with the ratio of traders long to short at 6.58 to 1. The number of traders net-long is 7.75% higher than yesterday and 7.16% higher from last week, while the number of traders net-short is 16.43% lower than yesterday and 25.13% lower from last week.
We typically take a contrarian view to crowd sentiment, and the fact traders are net-long suggests Gold prices may continue to fall.
Traders are further net-long than yesterday and last week, and the combination of current sentiment and recent changes gives us a stronger Gold-bearish contrarian trading bias.
--- Written by Christopher Vecchio, CFA, Senior Currency Strategist


