


Gold Price Forecast Overview:
- Gold prices remain in their multi-month downtrend, but budding bullish momentum on the daily timeframe necessitates other considerations, like a breakout to all-time highs in 2021.
- Gold prices are trading between the 23.6% and 38.2% Fibonacci retracements of the 2020 low/high range at between 1836.97 and 1928.05.
- According to the IG Client Sentiment Index, gold prices have a bearish outlook.
Gold Price Action Stabilizes
Gold prices have had a rocky week, thanks in part to the bevy of headlines over the weekend regarding Brexit and a US fiscal stimulus deal. Even as a Brexit deal has come in and out of reach in the past 72-hours, and outgoing US President Donald Trump has threated to veto the US fiscal stimulus deal, traders seem unconcerned. Perhaps it is the fatigue of 2020, or simply the end of the year, but markets lack a certain ‘zest’ ahead of Christmastime. It may be the case that an another attempt at all-time highs will have to wait until 2021, when liquidity returns to markets.
Gold Prices and Gold Volatility, Still Out of Sync
Gold prices have a relationship with volatility unlike other asset classes. While other asset classes like bonds and stocks don’t like increased volatility – signaling greater uncertainty around cash flows, dividends, coupon payments, etc. – gold tends to benefit during periods of higher volatility. Heightened uncertainty in financial markets due to increasing macroeconomic tensions increases the safe haven appeal of gold. Reduced political tensions tend to decrease the safe haven appeal of gold.

GVZ (Gold Volatility) Technical Analysis: Daily Price Chart (October 2008 to December 2020) (Chart 1)
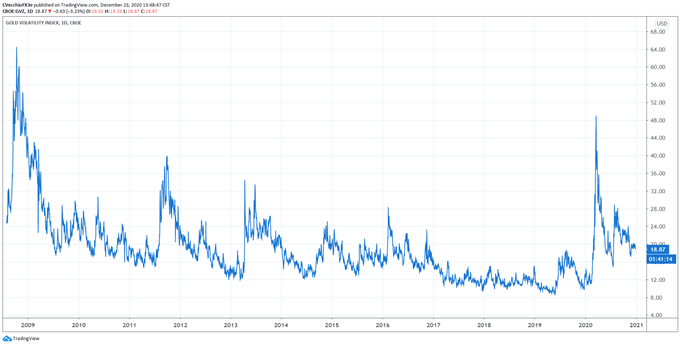
Gold volatility has eased in recent days, but shifts in volatility continue to do little for gold price action ahead of the holidays. Gold volatility (as measured by the Cboe’s gold volatility ETF, GVZ, which tracks the 1-month implied volatility of gold as derived from the GLD option chain) is trading at 18.87. The 5-day correlation between GVZ and gold prices is +0.54 while the 20-day correlation is +0.20; one week ago, on December 23, the 5-day correlation was +0.11 and the 20-day correlation was -0.42.
In previous gold price forecasts, it was noted that it “may no longer be the case that falling gold volatility is not necessarily a negative development for gold prices, whereas rising gold volatility has almost always proved bullish; in the same vein, gold volatility simply trending sideways is more positive than negative for gold prices.” If this axiom is broken, then traders may need to wait until volume returns to markets in early-2021 to see if any further developments have transpired.

Gold Price Rate Technical Analysis: Daily Chart (December 2019 to December 2020) (Chart 2)
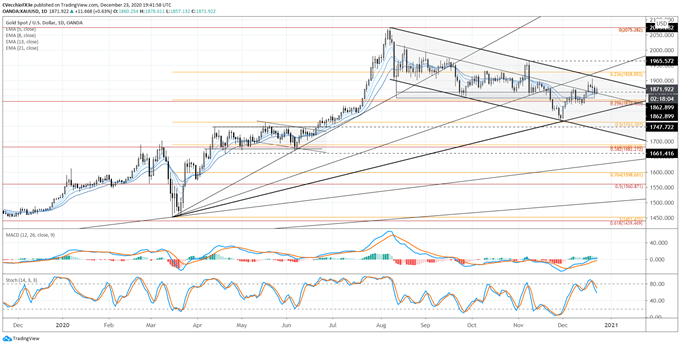
Gold prices’ technical structure has improved in recent days, after breaching the evening star candle cluster formed December 8-10. The doji candle on Monday and the inside bar on Tuesday suggest that there is hesitation in the market, but not enough to suggest the move higher is complete. But the prevailing bull flag remains, insofar as the channel from the August and November highs drawn against the September low has not been breached thus far.
Gold prices are above their daily 5-, 8-, 13-, and 21-EMA envelope, but the envelope is in neither bearish nor bullish sequential order. Daily MACD is starting to churn through its signal line, but daily Slow Stochastics are still falling below their median line. Even if there is growing bullish momentum, traders may need to be more patient and wait through the holidays before traction gathers pace.
Gold Price Technical Analysis: Weekly Chart (October 2015 to December 2020) (Chart 3)
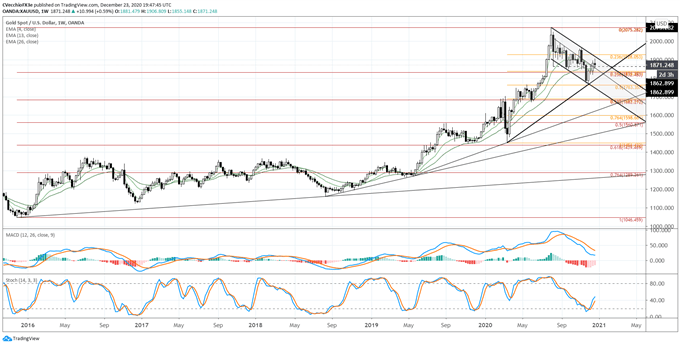
In the last update it was noted that we expected “the downtrend emanating from the all-time high to retain primacy.” In the past two weeks, this downtrend has not been broken. Gold prices are trading between the 23.6% and 38.2% Fibonacci retracements of the 2020 low/high range at between 1836.97 and 1928.05. Trading above the former would suggest a bullish breakout to new all-time highs would be getting started, while a drop below the latter would open the door for a retest of the November low at 1764.57.

IG CLIENT SENTIMENT INDEX: GOLD PRICE FORECAST (DECEMBER 23, 2020) (CHART 4)
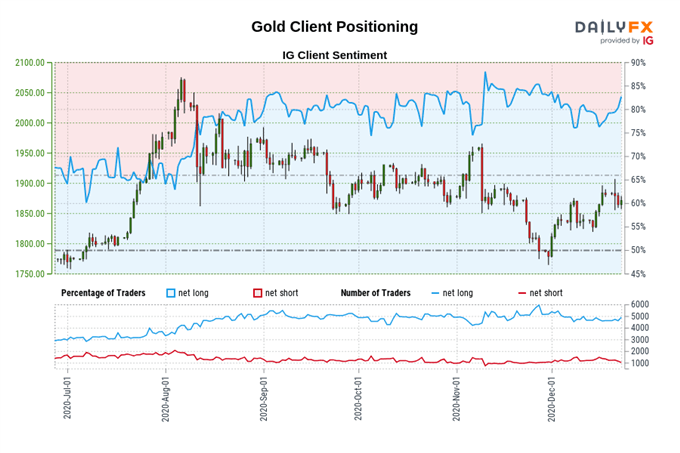
Gold: Retail trader data shows 82.29% of traders are net-long with the ratio of traders long to short at 4.65 to 1. The number of traders net-long is 3.65% higher than yesterday and 3.28% higher from last week, while the number of traders net-short is 9.20% lower than yesterday and 20.66% lower from last week.
We typically take a contrarian view to crowd sentiment, and the fact traders are net-long suggests Gold prices may continue to fall.
Traders are further net-long than yesterday and last week, and the combination of current sentiment and recent changes gives us a stronger Gold-bearish contrarian trading bias.
--- Written by Christopher Vecchio, CFA, Senior Currency Strategist


