


Gold Price Technical Highlights:
- Gold price falling from triangle formation
- Area around 1800 could become an important spot
Gold price falling from triangle formation
In Friday’s look-ahead piece, gold was a featured market due to the proximity of price to the apex of a nicely forming triangle pattern. The outlook was neutral, but with the break below 1902 it would turn bearish. Indeed, this week a bearish bias was confirmed on a break of the triangle and support.
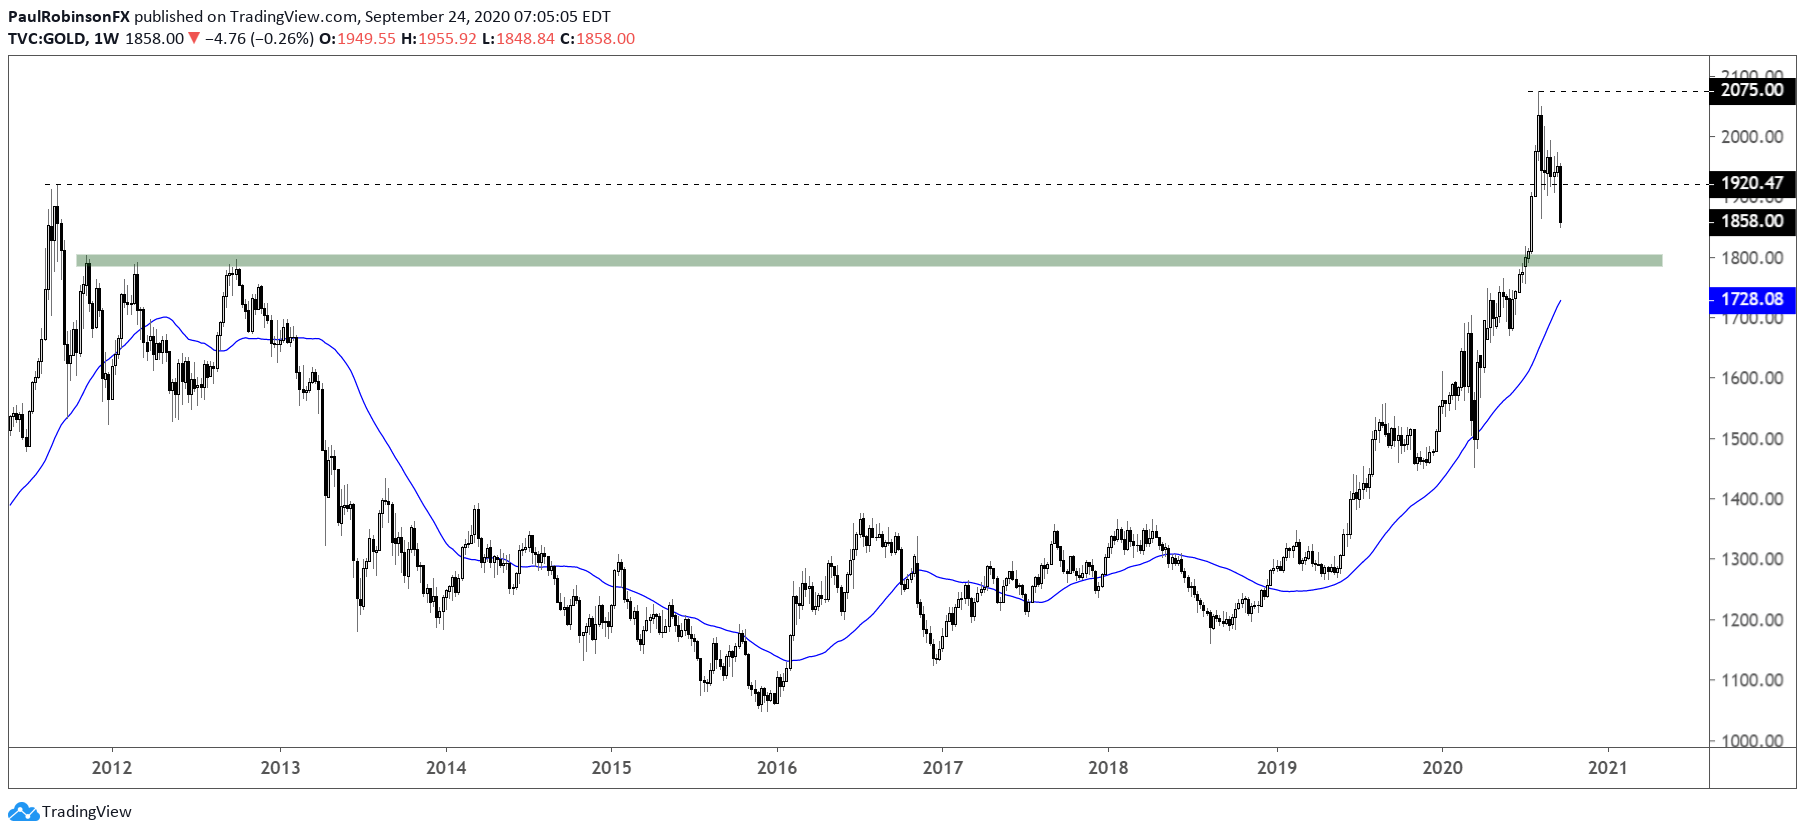
This development is looking to have the area around 1800 in play soon, perhaps any day now at the rate gold is moving. What makes this a significant area? After the record high in 2011 gold underwent a topping process that spanned from 2011 into 2012, and during that period three peaks formed in close proximity that envelope 1800.
To put it more precisely, from 1803 down to around 1770. So this is the first area I will be looking for buyers to show up and act as a potentially substantial level of support. If that doesn’t hold, though, the next point of the support is the rising 200-day moving average (currently @1723). This is also coming into confluence with the top of the April to June range.
Should price meet the aforementioned levels it will be important to watch how price action behaves, as it is possible that gold keeps on slipping through without any real meaningful signs of a reversal. If, however, we see sharp interest at support, then perhaps the longer-term trend will have found a spot to reassert itself from.
For the immediate future, will continue running with a bearish bias. Should price suddenly surge back into the triangle pattern, then the potential increases that the pattern breakdown was a false move and a rally could grow legs.

Gold Price Daily Chart (broke triangle, heading towards 1800)

Gold Price Weekly Chart (1800 area important from 2011/12)
Gold Price Charts by TradingView
Resources for Forex Traders
Whether you are a new or experienced trader, we have several resources available to help you; indicator for tracking trader sentiment, quarterly trading forecasts, analytical and educational webinars held daily, trading guides to help you improve trading performance, and one specifically for those who are new to forex.
---Written by Paul Robinson, Market Analyst
You can follow Paul on Twitter at @PaulRobinsonFX


