


Technical Outlook:
- EUR/JPY & AUD/JPY both look headed lower
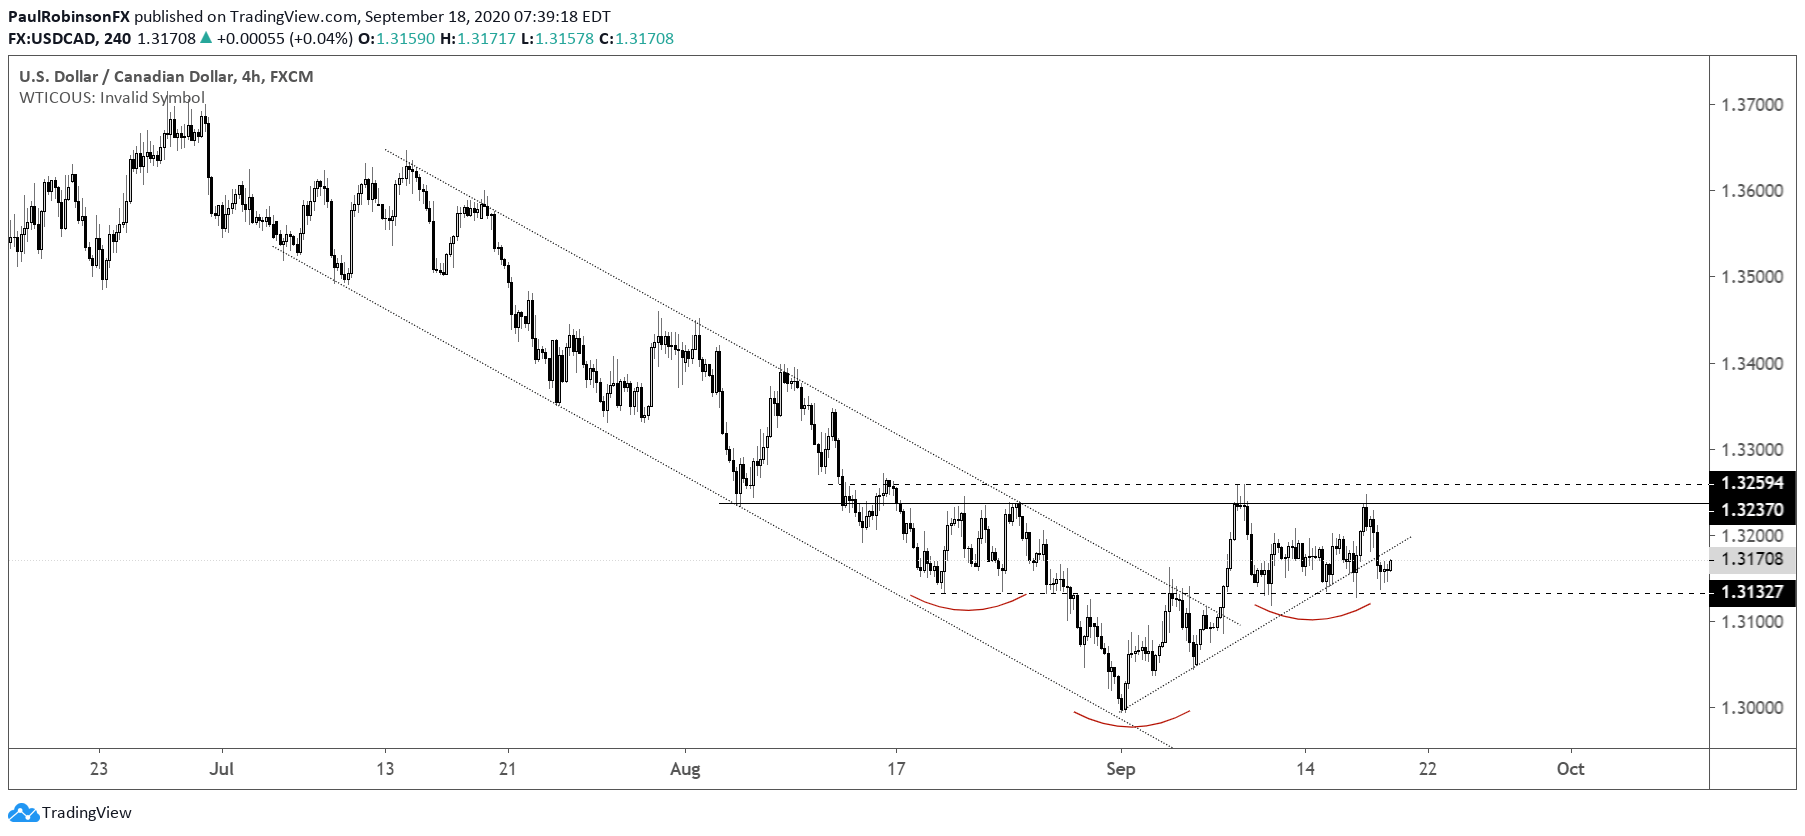
- USD/CAD hanging onto reversal pattern, but could fail
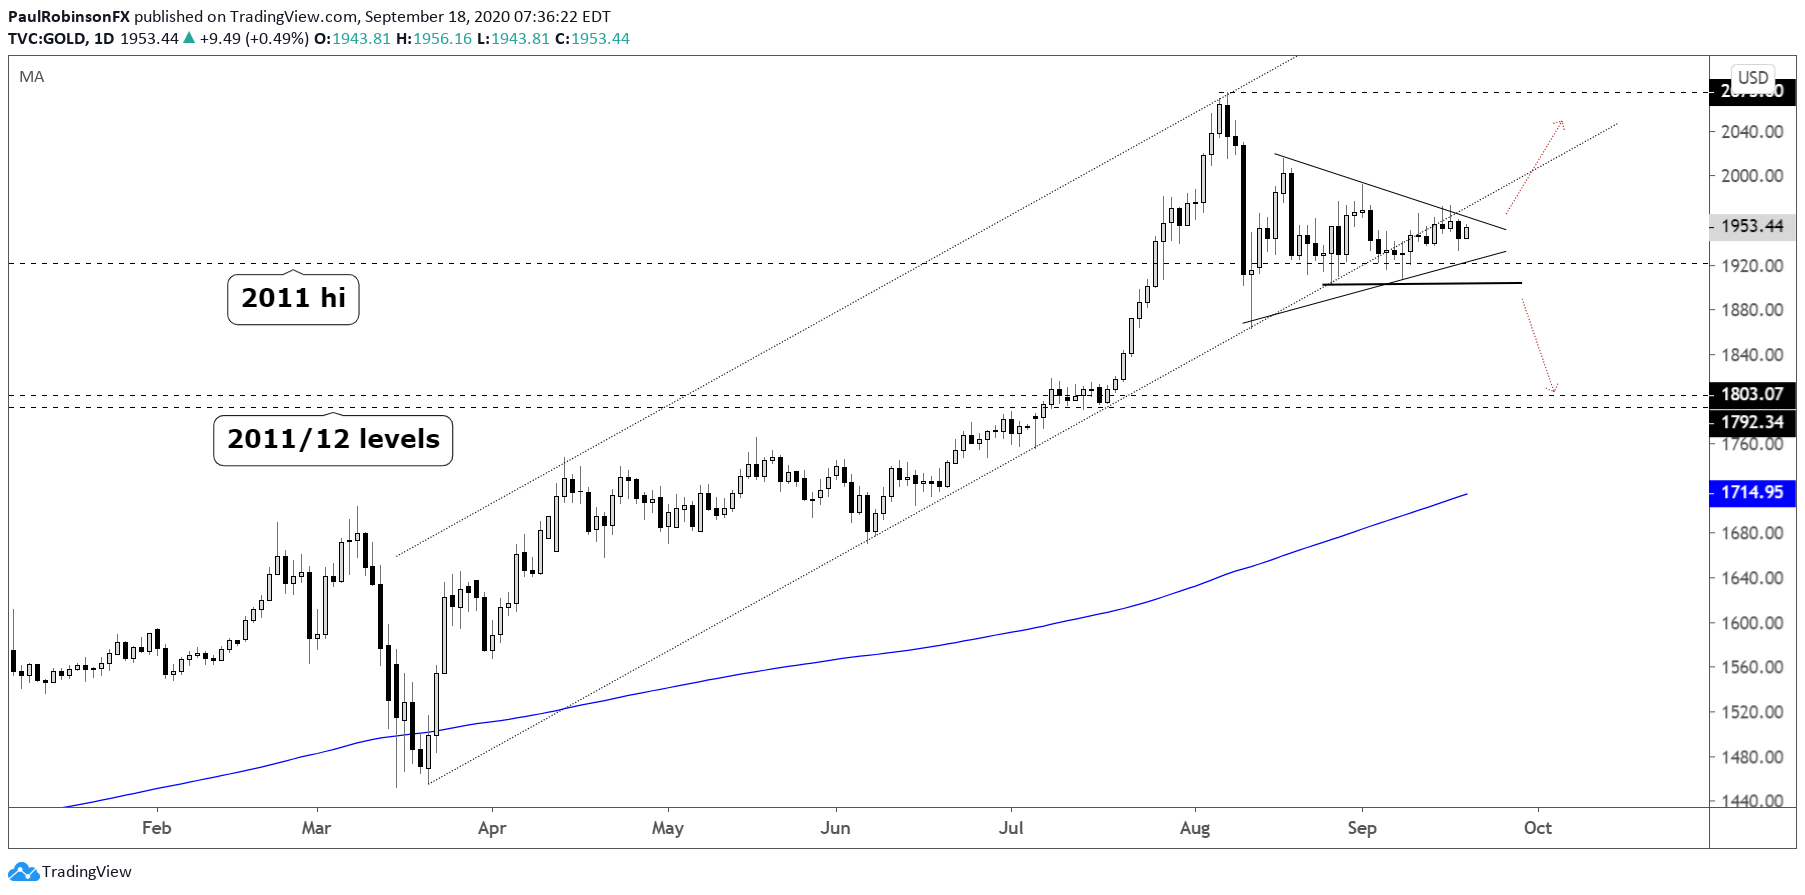
- Gold triangle set up to break soon
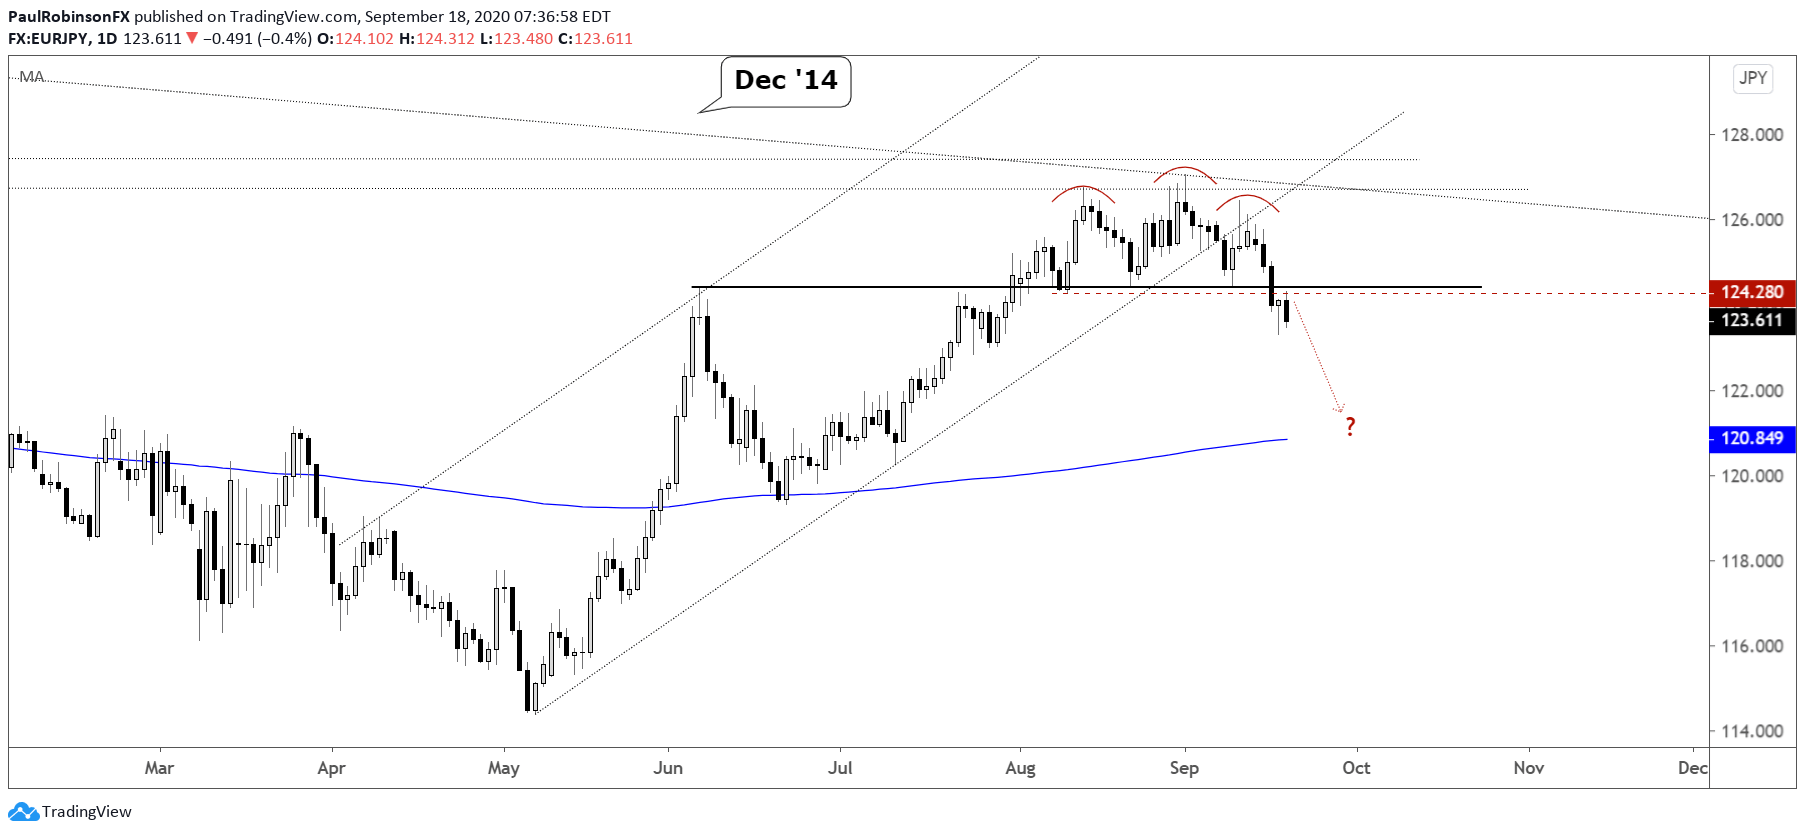
EUR/JPY broke the neckline of the head-and-shoulders pattern we looked at the other day. This is seen as potentially kicking off a leg lower towards the 200-day at 120.85. A firm close above 12445 would bring serious question into the validity of the breakdown. For now, running with a negative bias.

EUR/JPY Daily Chart (H&S triggered)
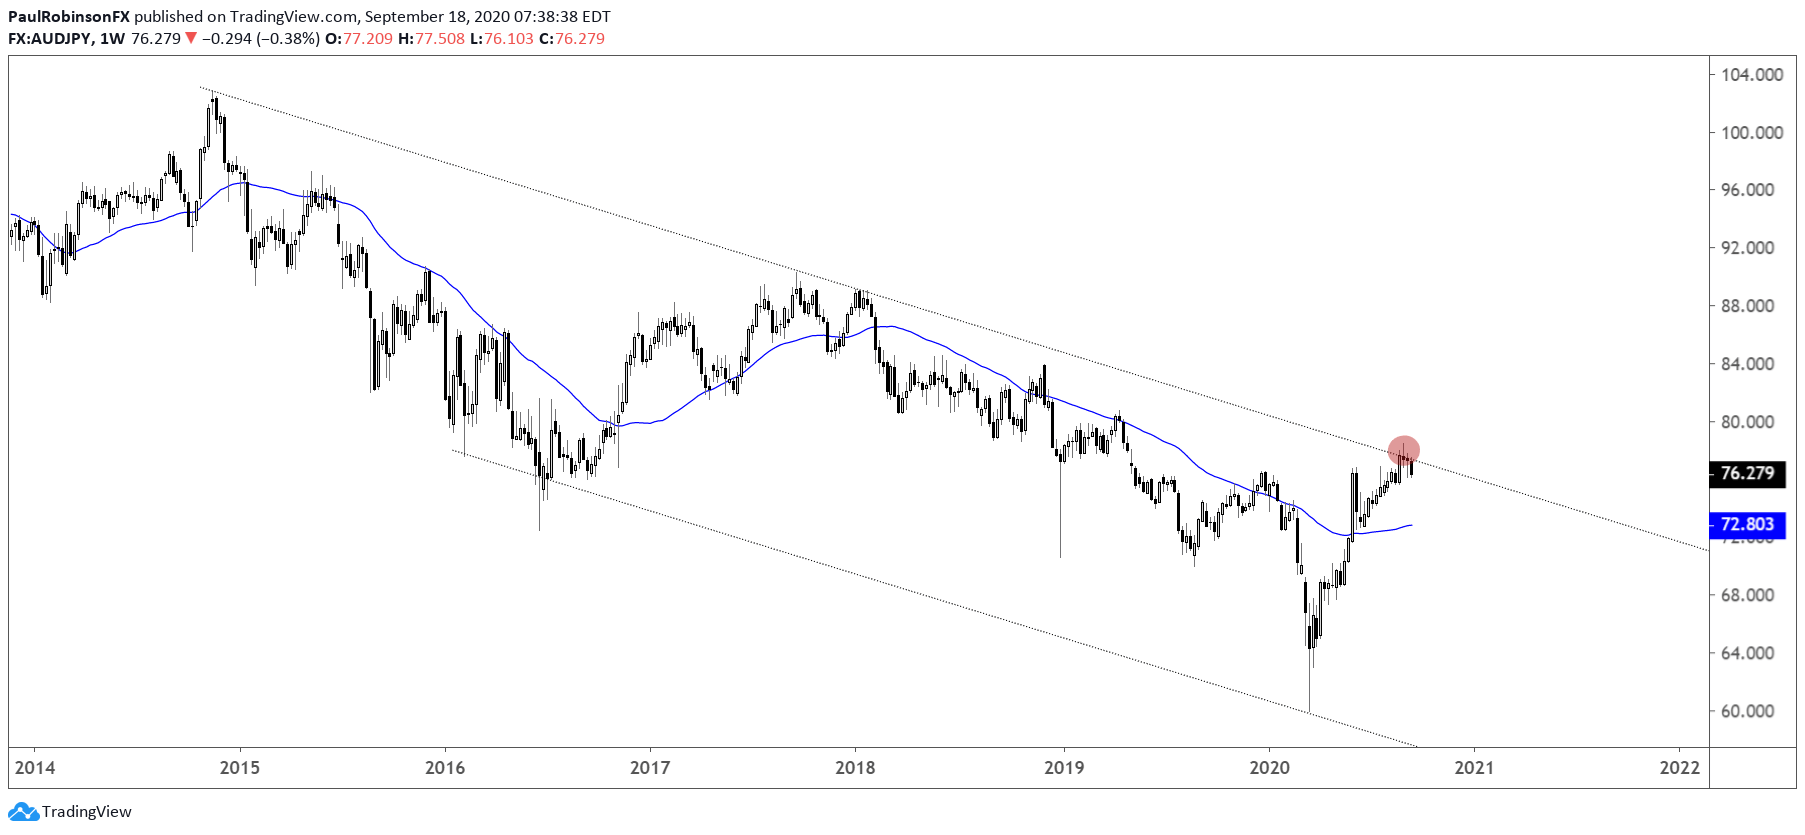
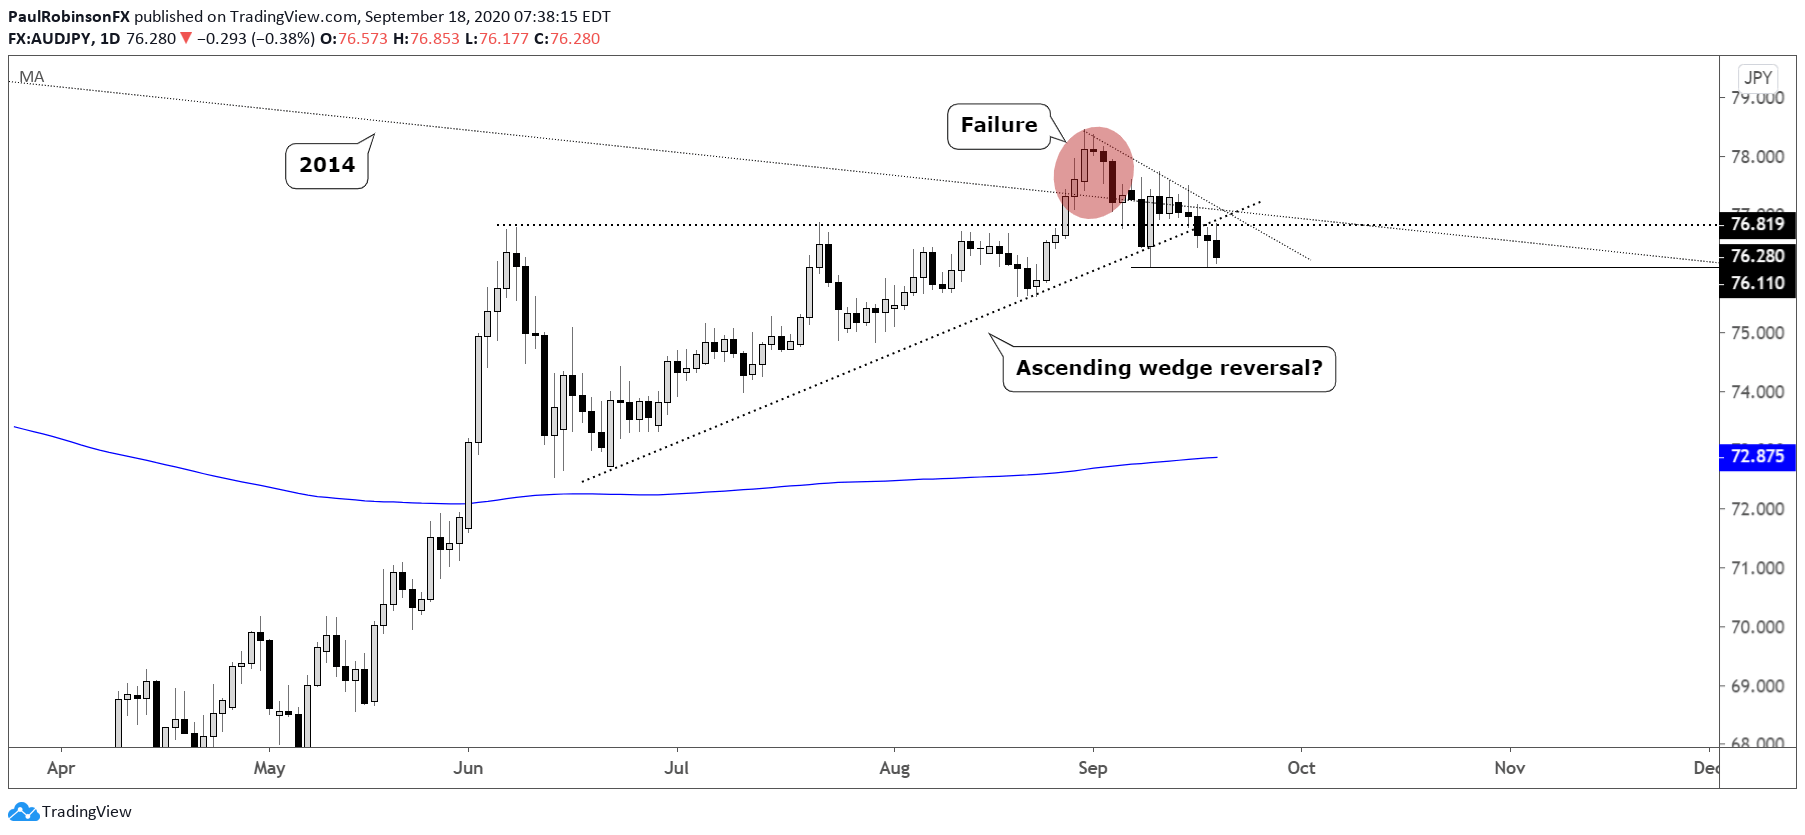
AUD/JPY is very near reversing a breakout from an ascending wedge. Technically, it has already triggered the reversal by breaking the underside trend-line off the pattern, but for an added layer of confirmation, a break below the September 8 low at 7611 is desired. Before doing that another kind of wedge could form, an descending variation starting back at the August 31 high.
In any event, given the broader ascending wedge pattern reversing after hitting long-term trend resistance we could signal a sizable reversal. Keep an eye on risk trends as well, with the S&P 500 looking fragile a further breakdown in stocks could help the bearish case for AUD/JPY shorts.
AUD/JPY Weekly Chart (big trend resistance)
AUD/JPY Daily Chart (close below 76.11 could be big)
USD/CAD has an inverse head-and-shoulders pattern developing, but if it can’t get into gear and trade above 13259 soon, then we could see the pattern fail to trigger and result in a continuation of the downtrend from the spring.
USD/CAD 4-hr Chart (H&S still on the table…)
Gold is putting in a pretty nice looking triangle, and doing so around an important area. The 2011 high and channel line from March are right in the vicinity of the apex. This could be a make or break situation in the near-term. A breakdown, confirmed by a drop below 1902, could send gold back to the important area immediately surrounding 1800. A break to the top-side and again the gold bull could charge again towards 2075 and better.
Gold Daily Chart (ready to move)
Resources for Forex Traders
Whether you are a new or an experienced trader, DailyFX has several resources available to help you; indicator for tracking trader sentiment, quarterly trading forecasts, analytical and educational webinars held daily, and trading guides to help you improve trading performance.
---Written by Paul Robinson, Market Analyst
You can follow Paul on Twitter at @PaulRobinsonFX


