GOLD PRICE OUTLOOK: XAU/USD EYES JANUARY US JOBS REPORT ON DECK FOR RELEASE
- Spot gold price action turns to monthly nonfarm payrolls (NFP) data due for release Friday, February 07 at 13:30 GMT
- Gold could continue climbing higher if the NFP report reveals that cracks are appearing across the US jobs market
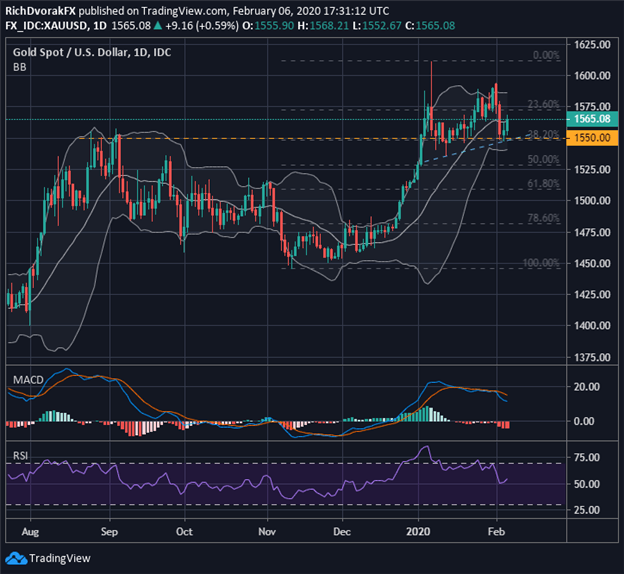
- XAU/USD seems to be finding technical support around the 1,550 zone while resistance resides near the 1,575 level
The monthly NFP report is scheduled to cross the wires Friday, February 07 at 13:30 GMT and stands to have a sizeable impact on spot gold price action.
While the price of gold is affected by many fundamental factors, the release of high-impact US jobs data such as nonfarm payrolls has a tendency of strong-arming bullion’s broader direction.
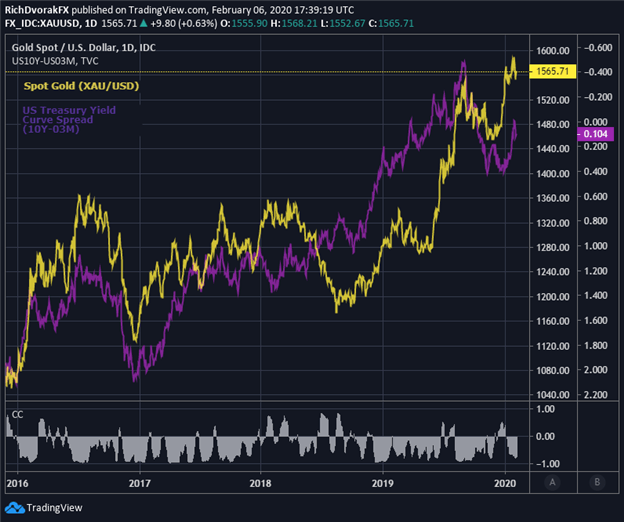
XAU/USD – SPOT GOLD PRICE CHART & INVERTED TREAUSRY YIELD CURVE: DAILY TIME FRAME (DECEMBER 2015 TO FEBRUARY 2020)

Chart created by @RichDvorakFX with TradingView
This is primarily due to the credence that US jobs data carries over at the Federal Reserve and future FOMC monetary policy decisions. In turn, this weighs on interest rate expectations and bold yields which overarchingly drives spot gold prices.
The US Treasury yield curve – specifically the spread between the 10-year and three-month maturities – broadly reflects the bond market’s outlook on the US economy as well as trader demand for safe-haven assets like Treasuries and gold.


That said, watching the reaction in the US Treasury yield curve spread following the release of NFP data tomorrow may serve as a bellwether to where spot gold price action trends next considering the typically strong negative relationship between gold and the US Treasury yield curve spread.
XAU/USD – GOLD PRICE CHART: DAILY TIME FRAME (JULY 2019 TO FEBRUARY 2020)

Chart created by @RichDvorakFX with TradingView
Subsequent to notching its highest close since April 2013 last week, XAU/USD has slid to test a technical support zone near the $1,550 mark.
This area of confluence is highlighted roughly by the September 2019 swing highs, year-to-date lows and also the 38.2% Fibonacci retracement level of spot Gold’s trading range since mid-November.
Nevertheless, negative divergence recorded by the MACD and RSI suggest bullish momentum has faded as spot gold struggles to make new highs.
| Change in | Longs | Shorts | OI |
| Daily | -3% | 0% | -2% |
| Weekly | 16% | -12% | 2% |
XAU/USD could come under pressure if upcoming NFP data underscores a robust US jobs market, which would likely revitalize appetite for risk and cause traders to steer away from bullion.
If nonfarm payrolls surprises to the downside, however, spot gold could catch a bid and retest technical resistance around $1,575 level and 23.6% Fib.
-- Written by Rich Dvorak, Junior Analyst for DailyFX.com
Connect with @RichDvorakFX on Twitter for real-time market insight


