


Gold Price Technical Highlights:
- Gold gradually trading lower following exhaustion formation
- Choppy price action expected in the near-term
- Eventually 2011/12 resistance should be fully broken
Gold gradually trading lower following exhaustion formation
Last week, gold posted a nasty turnabout, forming what I referred to as a “death needle” – a large reversal candlestick that positions for bearish price action. It was also noted at that time we would likely see some backing-and-filling versus an outright sharp decline.
So far, we have seen price behave in anticipated manner, and expect more of this to come in the weeks ahead as the digestion phase runs its course. Any rallies from here appear at high risk of failing, even if they initially appear to hold strong momentum.
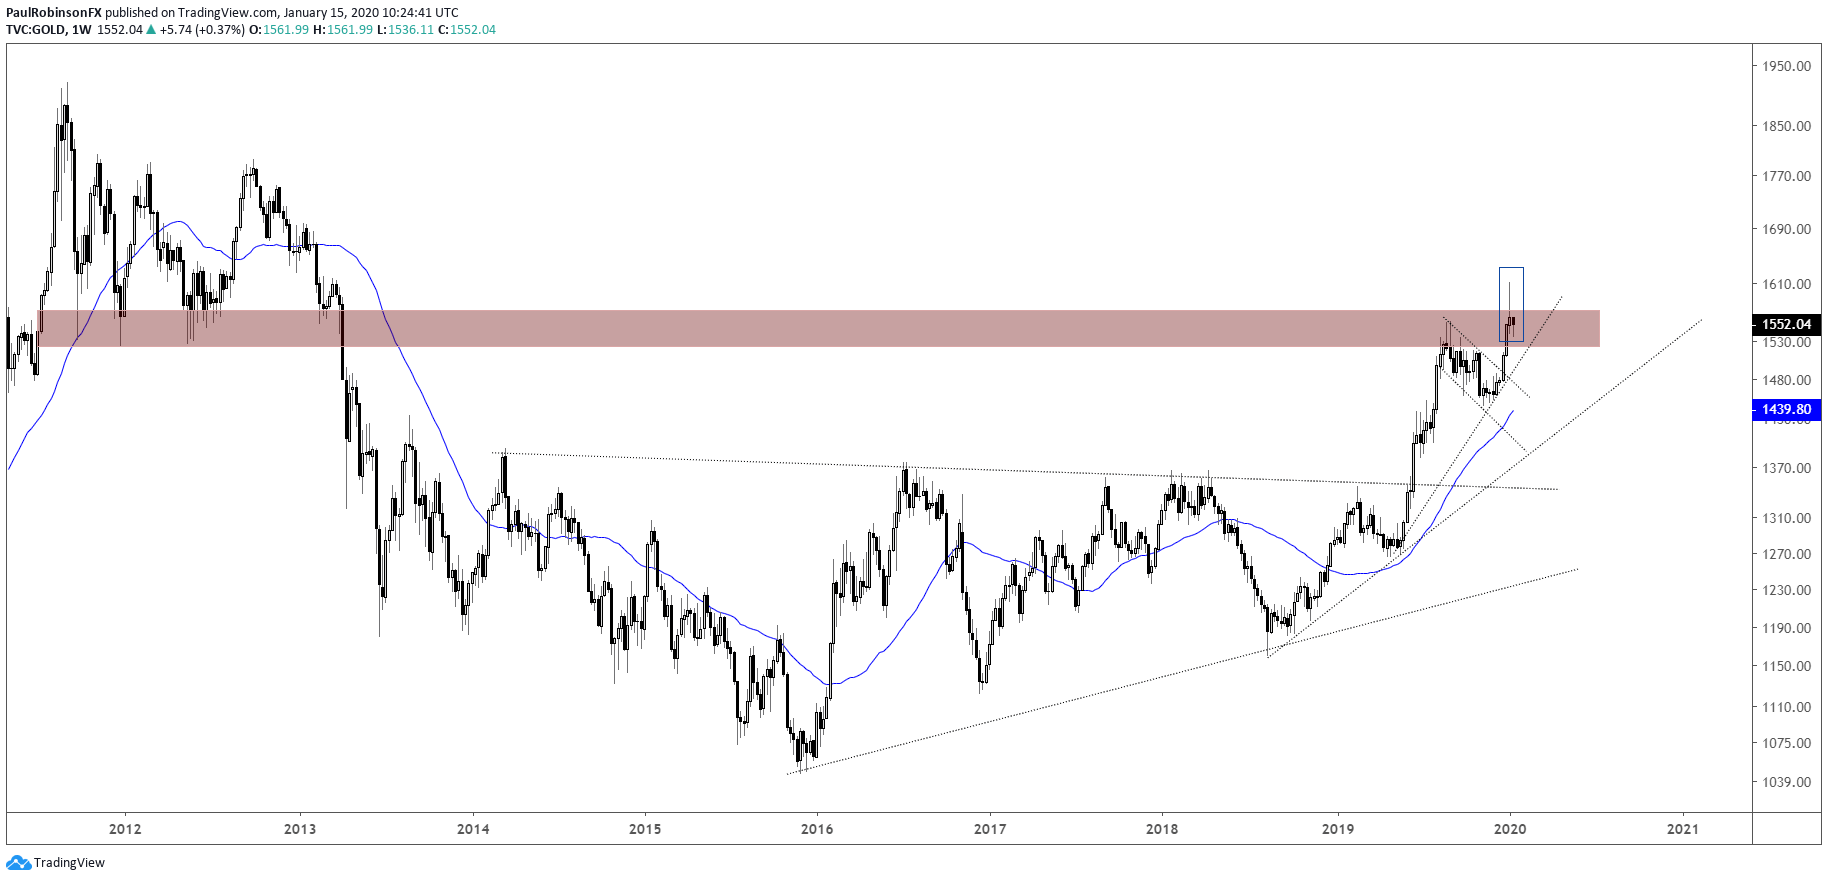
Not only does last week’s strong reversal highlight exhaustion, but it came around the all-important zone of resistance formed during the 2011/12 topping process. The knife through and swift rejection last Wednesday show just how important this zone is. It was a problem late summer, it’s a problem now.
But this doesn’t mean gold is doomed, it just means it needs more time to continue to make good on the run its been on since 2018. A few weeks of building up power again would do gold some good for seeing its way on through to the 1600s and higher in firm fashion.
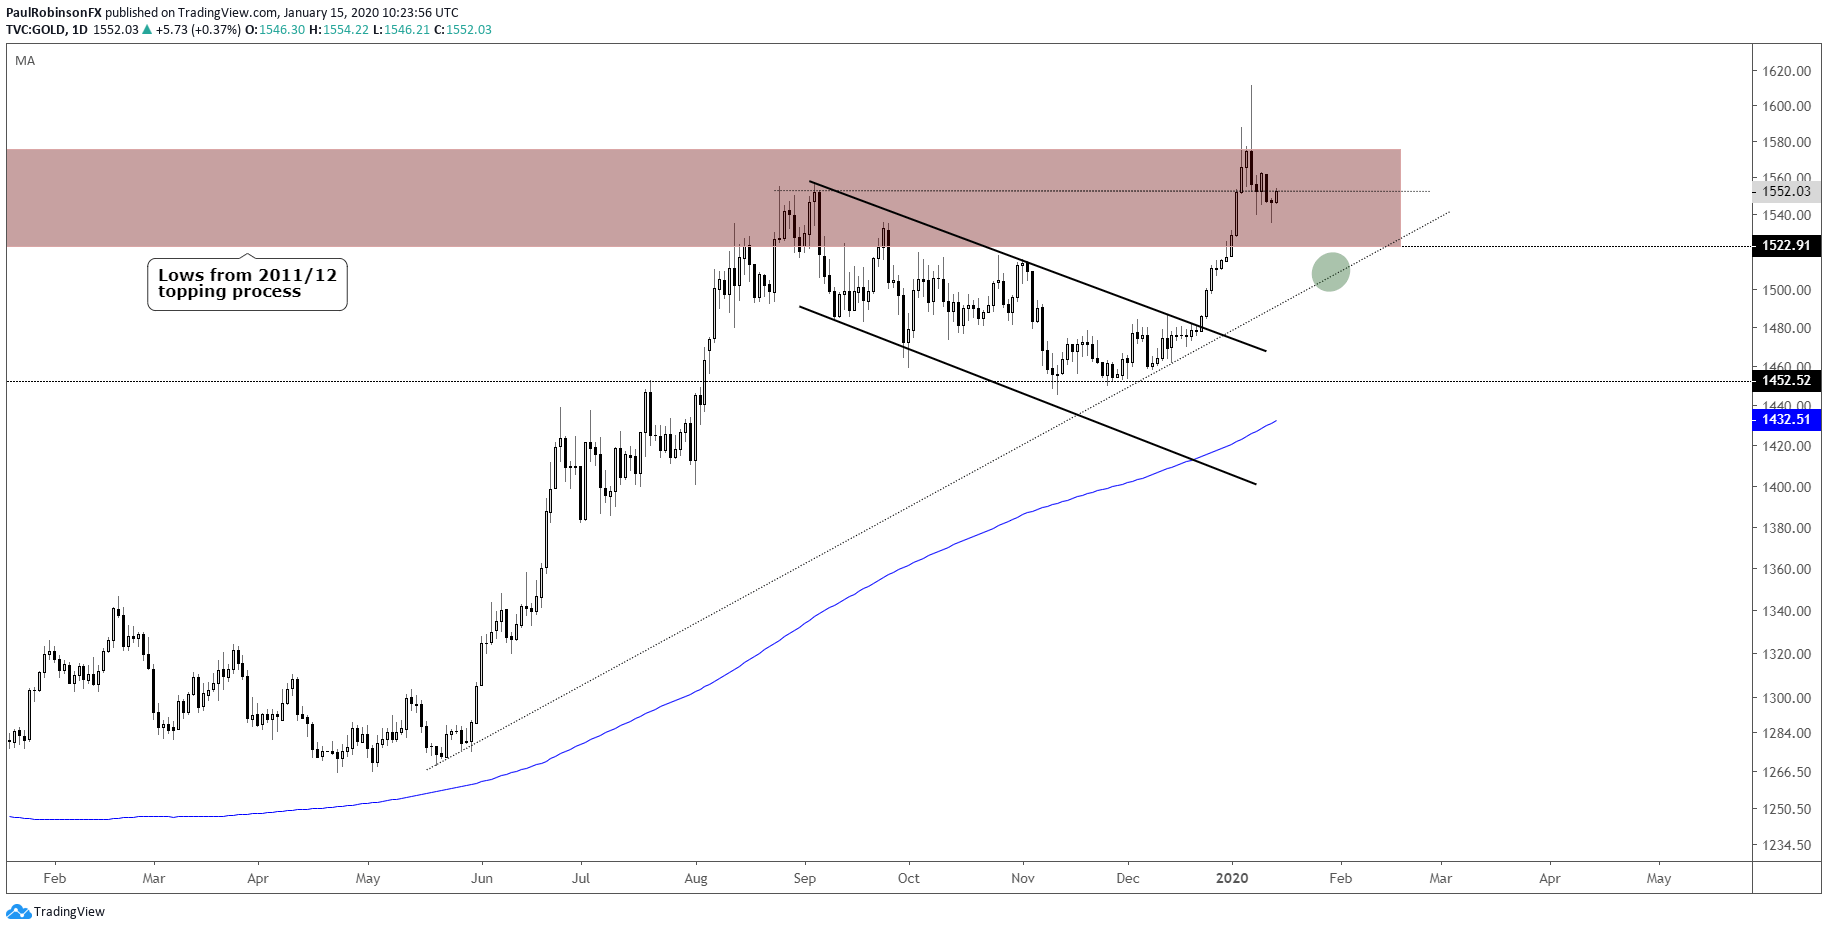
For now, sideways appears the best-case scenario, with potential to decline down towards the trend-line from May, currently near 1500. A decline to that point could end up providing a solid risk/reward entry for those who are patient.

Gold Price Daily Chart (to continue backing-and-filling)
Gold Price Weekly Chart (set to rally after 2011/12 zone broken)
Gold Price Charts by TradingView
***Updates will be provided on the above technical outlook in webinars held at 1030 GMT on Tuesday and Friday. If you are looking for ideas and feedback on how to improve your overall approach to trading, join me on Thursday each week for the Becoming a Better Trader webinar series.
Resources for Forex & CFD Traders
Whether you are a new or experienced trader, we have several resources available to help you; indicator for tracking trader sentiment, quarterly trading forecasts, analytical and educational webinars held daily, trading guides to help you improve trading performance, and one specifically for those who are new to forex.
---Written by Paul Robinson, Market Analyst
You can follow Paul on Twitter at @PaulRobinsonFX


