


Gold Price Forecast Overview:
- Confusing signals from policymakers regarding the US-China trade war have both helped and harmed gold prices at the start of December.
- Gold prices continue to trade lower within the downtrend from the September and November highs; only a move above 1490 would provoke an upgraded assessment in the near-term.
- Per the IG in IG Client Sentiment Index, gold prices have a mixed outlook at present time.
Looking for longer-term forecasts on Gold and Silver prices? Check out the DailyFX Trading Guides.
Dizzying Pace of US-China Trade War News
The start of December has produced mixed results for gold markets. Buoyed by concerns that the US-China trade war Phase 1 deal wouldn’t be signed before the end of the year, gold prices were able to start the last month of the year on strong footing. But, as has been fairly typical for the US-China trade war news cycle, a sharp reversal in rhetoric in a short-period of time has presented a challenge for the emerging technical narrative.
On December 3, US President Donald Trump noted that it was possible that the US-China trade war Phase 1 deal would not be signed until after the 2020 US presidential election. Alongside US Treasury yields falling by their most in a single day since mid-August, gold prices had their best one-day performance since the last week of October.
Yet as the calendar flipped to December 4, sentiment around the US-China trade war seemingly turned on a dime. At the NATO summit in London, US President Trump said that the US-China trade war negotiations were going “very well,” once more boosting hope that the world’s two largest economies will avoid a protracted conflict that imperils global growth.
Read more: Weekly Gold Price Forecast: Kicking the Can on a US-China Trade War Phase 1 Deal
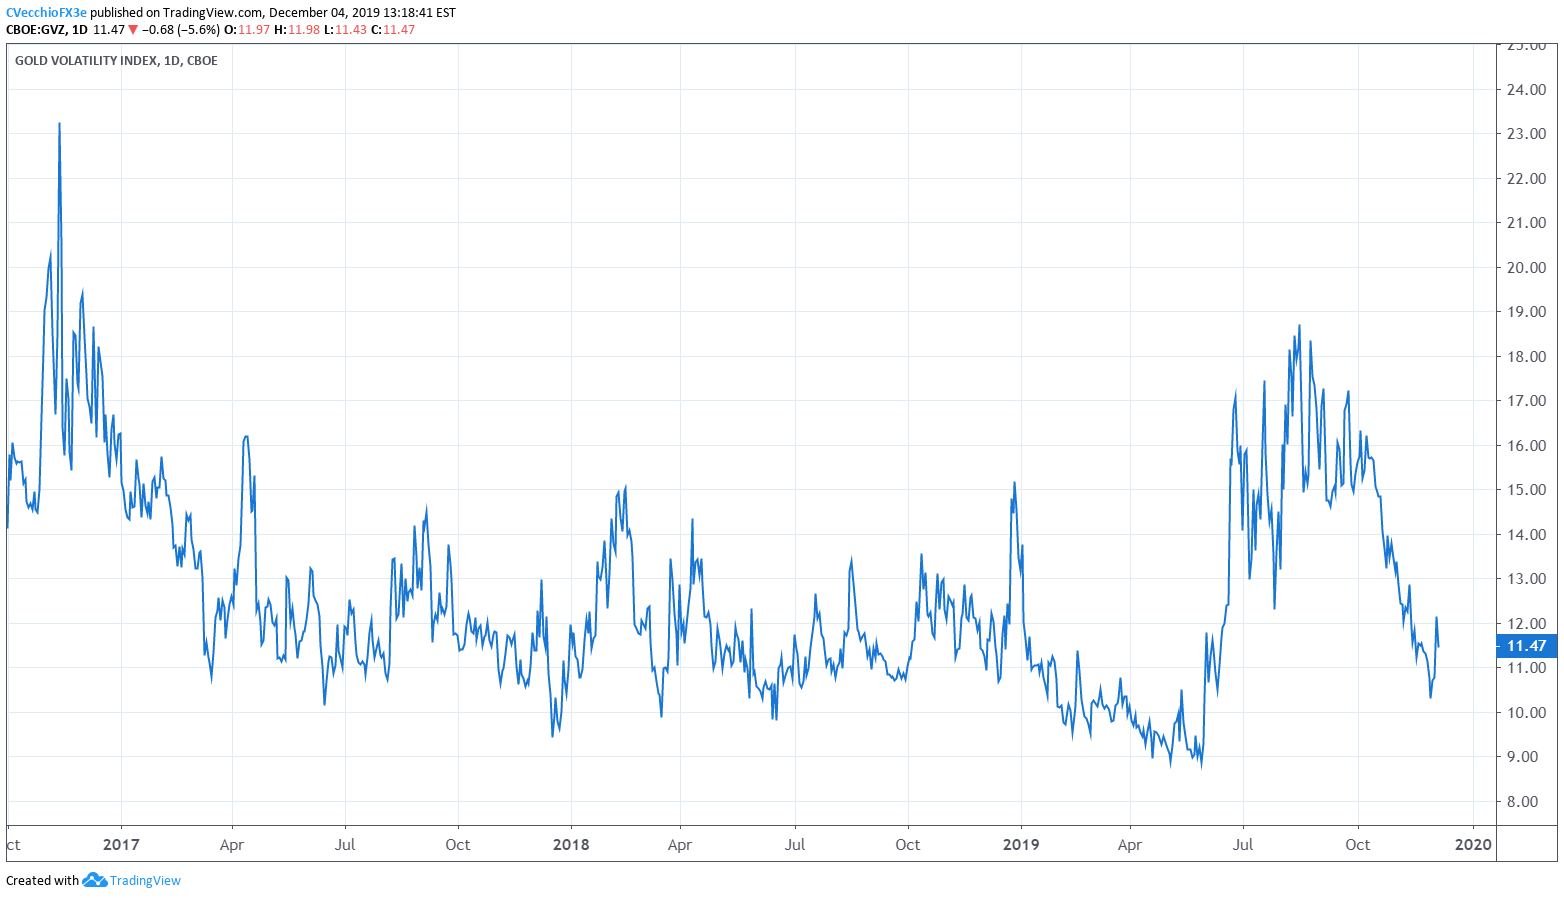
Gold Prices Tracking Gold Volatility Very Closely
Precious metals like gold have a unique relationship with volatility. While other asset classes don’t like increased volatility – signaling greater uncertainty around cash flows, dividends, coupon payments, etc. – precious metals tend to benefit during periods of higher volatility. Heightened uncertainty in financial markets due to increasing macroeconomic tensions (like US-China trade) increases the safe haven appeal of gold. On the other hand, decreased volatility tends to harm gold prices.
GVZ (Gold Volatility) Technical Analysis: Daily Price Chart (November 2016 to November 2019) (Chart 1)

Gold volatility (as measured by the Cboe’s gold volatility ETF, GVZ, which tracks the 1-month implied volatility of gold as derived from the GLD option chain) was trading at 11.47, just off its lowest level since mid-June (established in the last week of November).
Accordingly, the typical relationship between gold prices and gold volatility remains strong in the near-term: the 5-day correlation between GVZ and gold prices is 0.97 while the 20-day correlation is 0.25; in the most recent update, the 5-day correlation was 0.96 and the 20-day correlation was 0.63.
Gold Price Technical Analysis: Daily Chart - Descending Channel (December 2018 to December 2019) (Chart 2)
Gold prices continue to trade within the descending channel from the September and November highs breaks, and therefore it thus still holds, per the most recent gold price forecast update, “that the path of least resistance is to the downside.” The recent rally by gold prices around the confusing US-China trade war headlines may be setting up a ‘buy the rumor, sell the news’ type of opportunity as price approaches downtrend resistance.
Gold prices are above the daily 5-, 8-, 13-, and 21-EMA envelope, but the envelope is not in bullish sequential order. Daily MACD is now trending higher, although it remains in bearish territory. Slow Stochastics have reverted higher into bullish territory, now at their highest level in four-weeks, but gold prices have not returned to the levels at which they traded during the corresponding period.
Only upon a break of the downtrend from the September and November highs will the gold price outlook turn bullish; this week, such a break would occur above 1490. It still holds that “a move down below 1458.97 increases the odds of a return to the November low at 1445.51.”
Gold Price Technical Analysis: Weekly Chart – Inverse Head and Shoulders Pattern (July 2011 to December 2019) (Chart 3)

The weekly timeframe moves at a glacial pace, and thus there is no change since the last gold price forecast update. The gold price pullback since the October Fed meeting must be viewed in context of the longer-term technical picture: the gold price inverse head and shoulders pattern that originated earlier this year is still valid. Only a break below the August 1 bullish outside engulfing bar low at 1400.38 would draw into question the longer-term bullish potential.
Depending upon the placement of the neckline, the final upside targets in a potential long-term gold price rally vary: conservatively, drawing the neckline breakout against the January 2018 high at 1365.95 calls for a final target at 1685.67; aggressively, drawing the neckline breakout against the August 2013 high at 1433.61 calls for a final target at 1820.99.
IG Client Sentiment Index: Gold Price Forecast (December 4, 2019) (Chart 4)

Gold: Retail trader data shows 73.1% of traders are net-long with the ratio of traders long to short at 2.72 to 1. The number of traders net-long is 9.9% lower than yesterday and 9.8% lower from last week, while the number of traders net-short is 5.3% higher than yesterday and 2.3% higher from last week.
We typically take a contrarian view to crowd sentiment, and the fact traders are net-long suggests gold prices may continue to fall. Yet traders are less net-long than yesterday and compared with last week. Recent changes in sentiment warn that the current gold price trend may soon reverse higher despite the fact traders remain net-long.
Read more: Weekly Gold Price Forecast: Kicking the Can on a US-China Trade War Phase 1 Deal
FX TRADING RESOURCES
Whether you are a new or experienced trader, DailyFX has multiple resources available to help you: an indicator for monitoring trader sentiment; quarterly trading forecasts; analytical and educational webinars held daily; trading guides to help you improve trading performance, and even one for those who are new to FX trading.
--- Written by Christopher Vecchio, CFA, Senior Currency Strategist
To contact Christopher Vecchio, e-mail at cvecchio@dailyfx.com
Follow him on Twitter at @CVecchioFX
View our long-term forecasts with the DailyFX Trading Guides


