


- Gold prices pull back from key technical resistance range- constructive above 1208
- Check out our 3Q projections in our Free DailyFX Gold Trading Forecasts
- Join Michael for Live Weekly Strategy Webinars on Mondays at 12:30GMT
Gold is down more than 1.6% off the recent highs with the pullback in price now targeting uptrend slope support ahead of the October close. These are the updated targets and invalidation levels that matter on the XAU/USD charts. Review this week’s Strategy Webinar for an in-depth breakdown of this setup and more.
New to Gold Trading? Get started with this Free How to Trade Gold -Beginners Guide
Gold Daily Price Chart (XAU/USD)

Technical Outlook: In our latest Gold Weekly Technical Outlook we continued to highlight a key resistance barrier in gold at 1235/38- “a region defined by the 38.2% retracement of the yearly range, the 100% extension of the advance off the August low, the December swing low and the long 200-week moving average.” Gold tested this threshold for five consecutive days with a blow-off high on Friday giving way to a pullback into the 100-day moving average at ~1220. Key daily support remains at 1214/15 with broader bullish invalidation steady at 1208- both levels of interest for possible exhaustion / long-entries IF reached.
Why does the average trader lose? Avoid these Mistakes in your trading
Gold 240min Price Chart (XAU/USD)
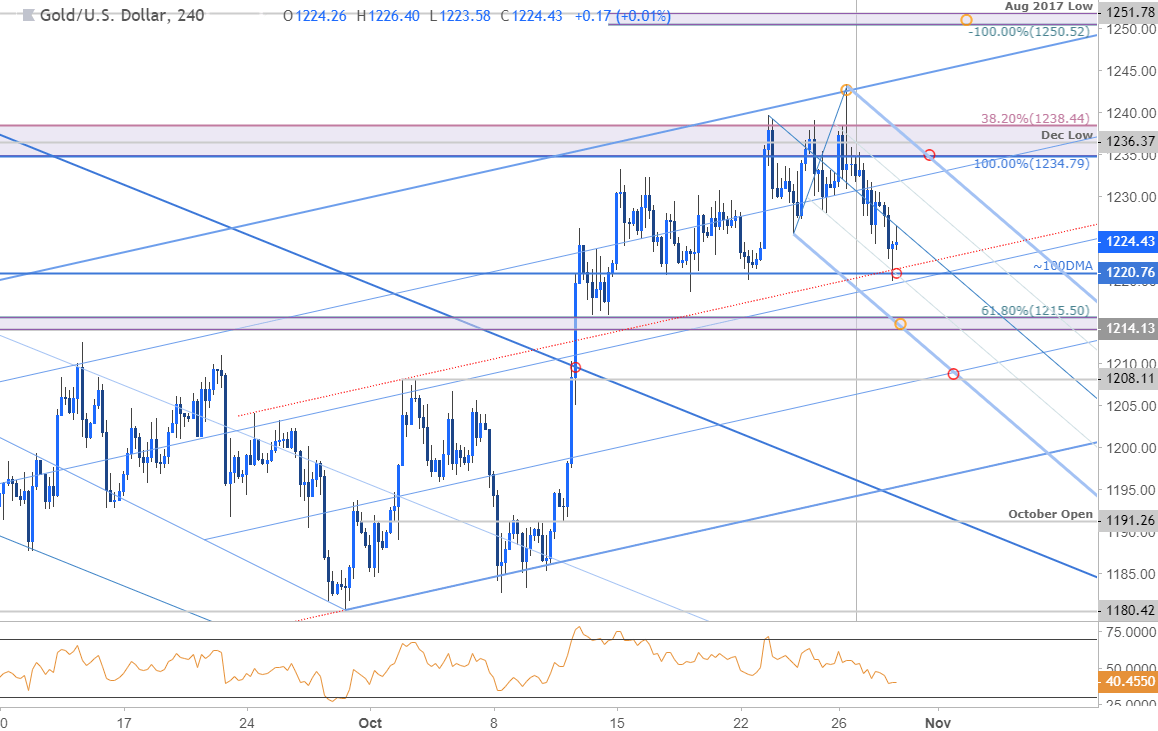
Notes: A closer look at price action shows gold continuing to trade within the confines of the ascending pitchfork formation we’ve been tracking since the start of the month. A near-term slope off the highs might be in play here and further highlights the aforementioned support levels. A breach above 1238 is needed to fuel the next leg higher with such a scenario targeting subsequent resistance objectives at the upper parallel (currently ~1245) backed by 1250/52 and the 50% retracement of the yearly range at 1261/63.
Learn how to Trade with Confidence in our Free Trading Guide
Bottom line: The outlook remains largely unchanged from last week’s Gold Scalp Report - the risk remains for a deeper correction here while below 1235 before resumption of the broader up-trend. From a trading standpoint I’m looking for possible price exhaustion on a drop towards the lower parallel / 1214/15 or even 1208.
For a complete breakdown of Michael’s trading strategy, review his Foundations of Technical Analysis series on Building a Trading Strategy
Gold Trader Sentiment

- A summary of IG Client Sentiment shows traders are net-long Gold - the ratio stands at +5.18 (83.8% of traders are long) – bearish reading
- Long positions are 2.8% lower than yesterday and 3.4% lower from last week
- Short positions are 5.6% lower than yesterday and 17.0% lower from last week
- We typically take a contrarian view to crowd sentiment, and the fact traders are net-long suggests Gold prices may continue to fall. Traders are further net-long than yesterday and last week, and the combination of current positioning and recent changes gives us a stronger Spot Gold-bearish contrarian trading bias from a sentiment standpoint.
See how shifts in Gold retail positioning are impacting trend- Learn more about sentiment!
---
Active Trade Setups
- NZD/USD Price Outlook: Kiwi Carries Breakout Potential
- EUR/USD Price Outlook: Euro Sell-off Intensifies– Support In View
- GBP/JPY Price Outlook: Bears Pound Support to Fresh Lows
- Crude Oil Price Outlook: WTI Breakdown Testing Initial Support
- USD/CAD Price Outlook: Canadian Dollar on the Edge ahead of BOC
- Written by Michael Boutros, Currency Strategist with DailyFX
Follow Michael on Twitter @MBForex or contact him at mboutros@dailyfx.com


