


Talking Points:
- Gold prices started a bullish trend in mid-December, rallying from a low of $1,236.
- The past few days have finally seen that bullish trend pull back; but will buyers respond to near-term support?
- Gold is currently carrying heavy bullish retail exposure, with a +2.0 read via IG Client Sentiment.
Gold's Bullish Trend Takes a Pause
Gold prices took a hit in the early-portion of December. As markets braced for another rate hike from the Federal Reserve, Gold sold-off from the $1,296 resistance level all the way down to $1,236. But, after establishing support around the time of that rate hike, bulls returned and didn’t look back; prices had re-ascended to $1,296 by the end of the month, and the early portion of 2018 saw that bullish trend continue all the way up to fresh near-term high of $1,344, which was set shortly after the Sunday open this week.
Gold four-hour: Bulls Take Over After the FOMC December Rate Hike
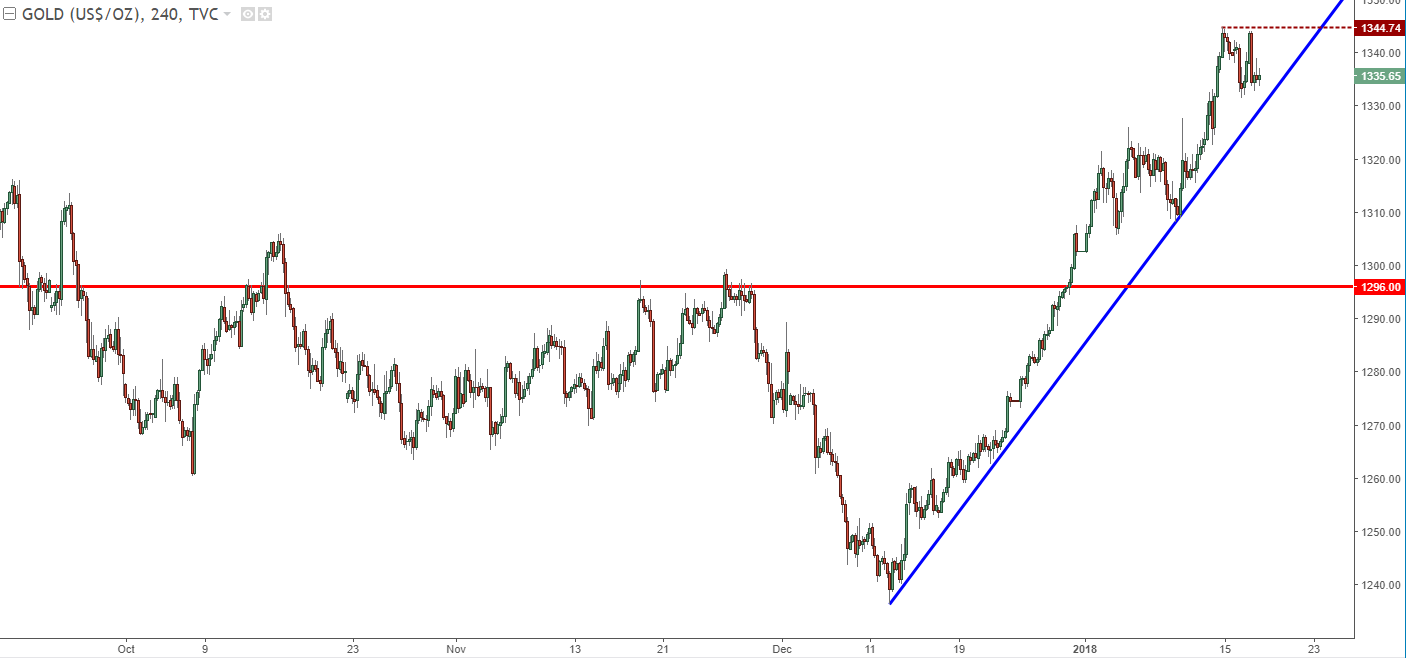
Chart prepared by James Stanley
Will Buyers Respond to Support?
After setting that fresh four-month high earlier in the week, bulls have been unable to continue the move-higher. Prices have pulled back to carve out near-term support around $1,332, which was a prior swing-high in Gold prices when the bullish trend was on the way up. Also of relevance, this near-term high came-in very close to a prior unfilled gap from all the way back in September. Prices closed the week on September 8th at $1,345.90, but opened the following week at $1,338.86. Until recently, that gap remained largely unfilled; but with prices running up to a fresh near-term high at $1,344, this leaves a portion of that gap remaining, from $1,344.74 up to $1,345.90.
Gold Hourly with Near-Term Support and Resistance Applied
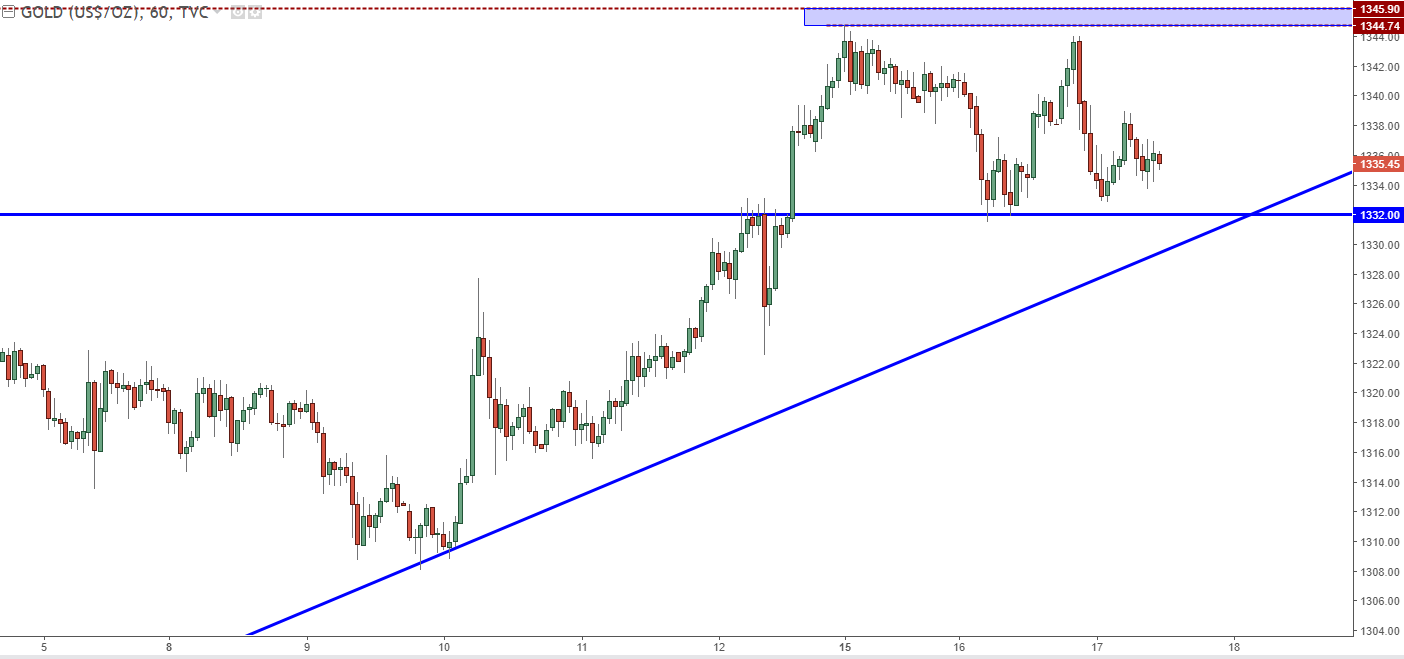
Chart prepared by James Stanley
Moving Forward
A big portion of this bullish move in Gold prices has been a response to a continuation of U.S. Dollar weakness, so for those looking at top-side exposure, a continuation of the pain trade in USD will likely be a necessary component to further upside in Gold prices.
Continued support above $1,332 keeps the door open for bullish strategies, with targets directed to near-term resistance levels of $1,344.74. A top-side break of this high, and a touch of the prior gap at $1,345.90 can also be construed as bullish; but traders should be careful of a pullback from those levels should the September gap get filled. Additional resistance/top-side targets can be directed towards $1,350 (major psychological level), $1,357.50 (the 2017 high) and then $1,367 and $1,375 (the three-year high).
To read more:
Are you looking for longer-term analysis on Gold prices? Our DailyFX Forecasts for Q1 have a section specifically for Gold. We also offer a plethora of resources on our Gold page, and traders can stay up with near-term positioning via our IG Client Sentiment Indicator.
Chart prepared by James Stanley
--- Written by James Stanley, Strategist for DailyFX.com
To receive James Stanley’s analysis directly via email, please SIGN UP HERE
Contact and follow James on Twitter: @JStanleyFX


