


Silver Price Outlook:
- Silver prices have staged a meaningful bullish reversal this week.
- The pause in the rally at the August high and Fibonacci retracement cluster may be temporary, but more significant hurdles still remain ahead.
- Recent changes in sentiment suggest that silver prices have a bearish bias.
Holding Out for a Pause
The surge in US stocks, US Treasuries, commodities, cryptocurrencies, and the drop by the US Dollar (via the DXY Index) are all rooted in the same speculative impulse: that the Federal Reserve will soon signal that it intends to slowdown the pace of its rate hikes, culminating in a ‘pause’ in early-2023. The drop in US real yields in recent days has been ground zero for this speculative impulse, which has helped enable an impressive performance by precious metals, and silver prices in particular, at the start of October.
Of course, no Fed policymakers have actually argued for a pause, nor has US inflation data rolled over in a meaningful enough way to truly warrant the jubilant narrative that the end of the Fed rate hike cycle is nearing. Thus, while the silver price rally at the start of 4Q’22 has been noteworthy – truly technically significant – it is reasonable to cast some dispersion on the notion of a sustained rally moving forward.

Silver Prices and Volatility Relationship Inverted
Both gold and silver are precious metals that typically enjoy a safe haven appeal during times of uncertainty in financial markets. While other asset classes don’t like increased volatility (signaling greater uncertainty around cash flows, dividends, coupon payments, etc.), precious metals tend to benefit from periods of higher volatility as uncertainty increases silver’s safe haven appeal. However, this may not be one of those times: reduced US equity market volatility is tied to the belief that the Fed won’t raises rates as aggressively moving forward, which is beneficial for silver prices.
VIX (US S&P 500 VOLATILITY) versus Silver Price TECHNICAL ANALYSIS: DAILY PRICE CHART (September 2021 to September 2022) (CHART 1)
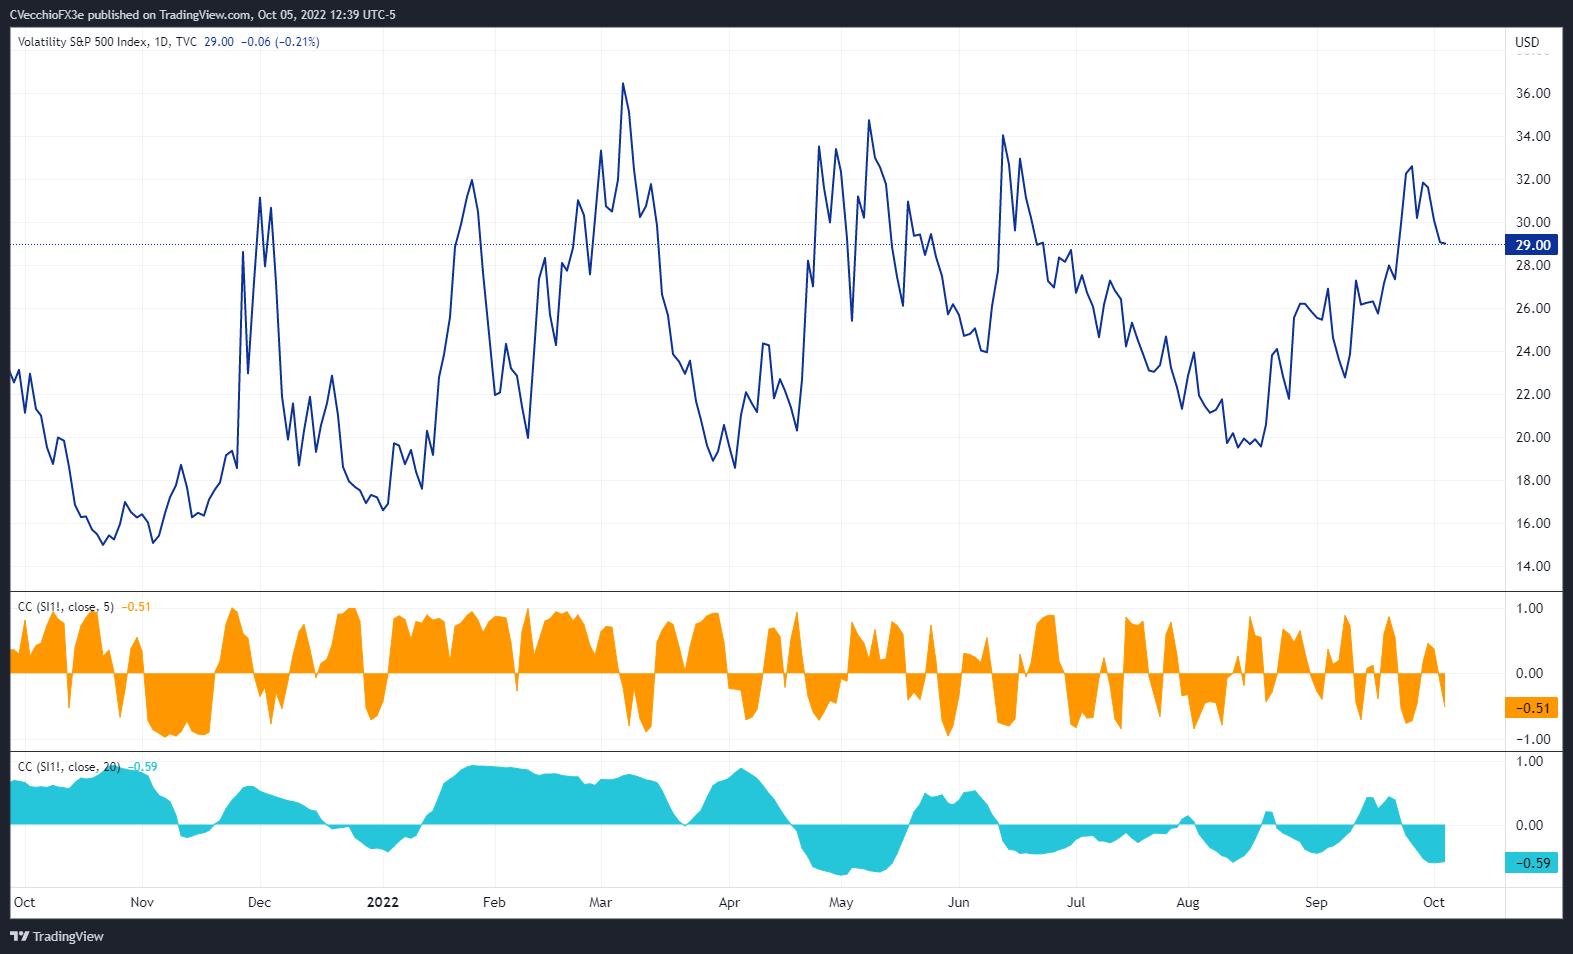
US stock market volatility (as measured by the US S&P 500 volatility index, VIX, which tracks the stock market's expectation of volatility based on S&P 500 index options) was trading at 29.00 at the time this report was written. The 5-day correlation between the VIX and silver prices is -0.51 and the 20-day correlation is -0.59. One week ago, on September 28, the 5-day correlation was -0.46 and the 20-day correlation was -0.40.
SILVER PRICE TECHNICAL ANALYSIS: DAILY CHART (October 2021 to October 2022) (CHART 2)
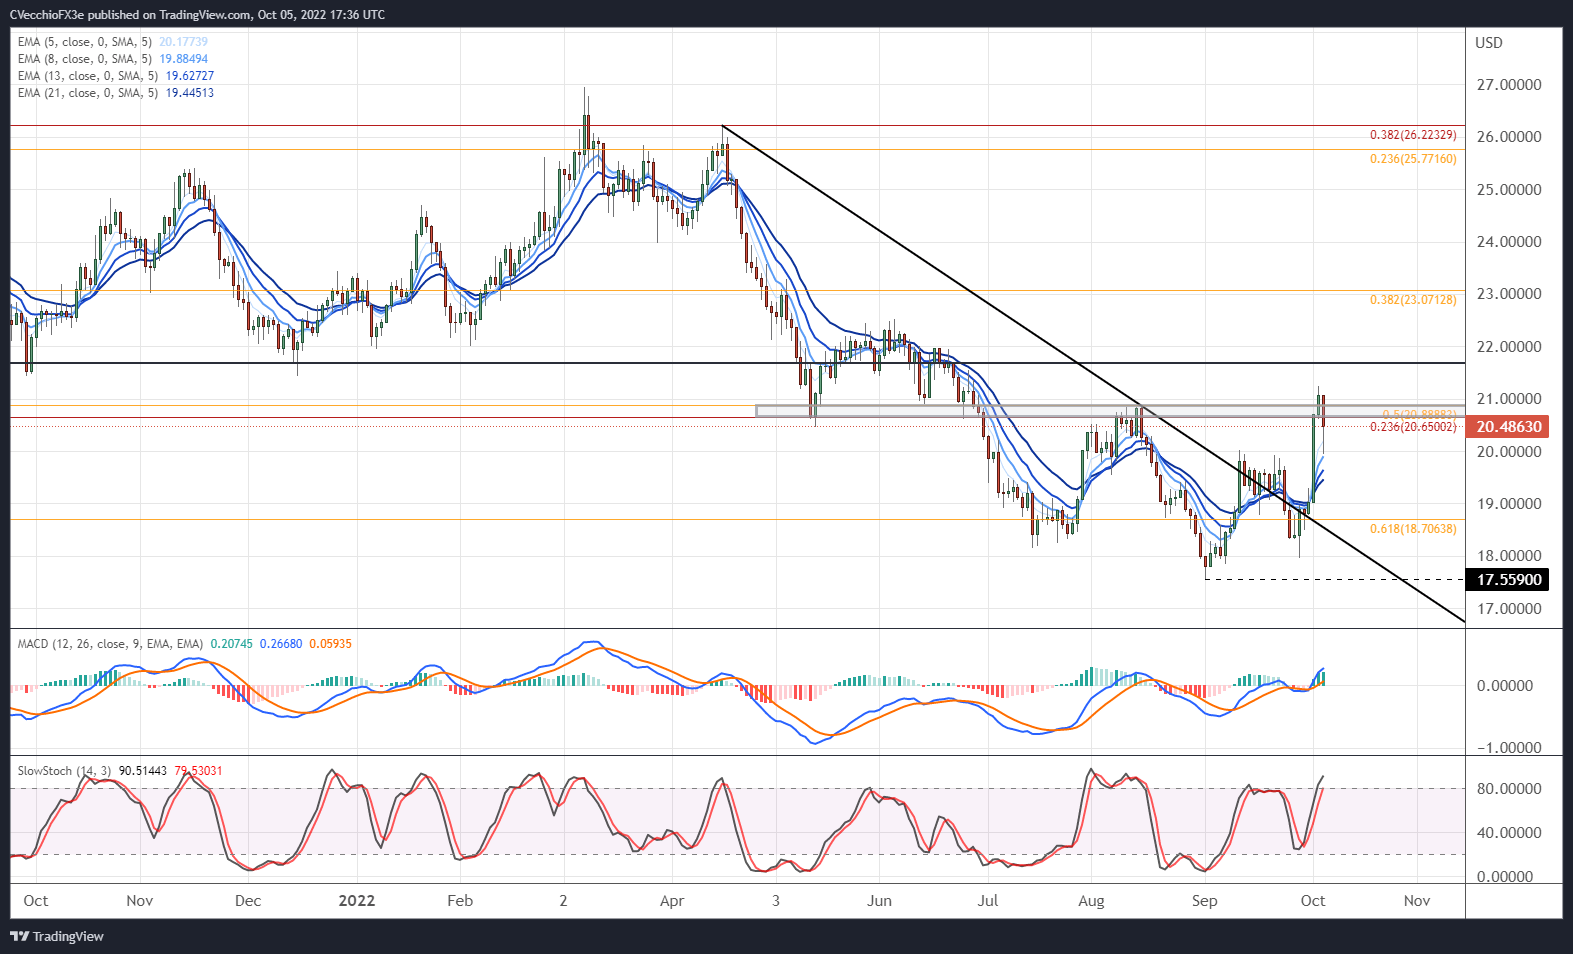
The rally by silver prices at the start of October has seen the precious metal trade to its highest level since late-June after breaking the downtrend from the April (yearly high) and August swing highs. But the rally has paused at a familiar juncture: the August high at 20.8435; and the area around a cluster of Fibonacci levels, the 23.6% retracement of the 2011 high/2020 low range and the 50% retracement of the 2020 low/2021 high range between 20.6500/20.8888.
Despite finding resistance, momentum remains bullish. Silver prices found support today at their daily 5-EMA, while the daily 5-, 8-, 13-, and 21-EMA envelope remains in bullish sequential order. Daily MACD is trending higher above its signal line, while daily Slow Stochastics are back in overbought territory. Should silver prices hurdle the area around 20.6500/20.8888, however, another significant level of resistance lies immediately above that has longer-term implications for a meaningful push higher.
SILVER PRICE TECHNICAL ANALYSIS: WEEKLY CHART (November 2010 to October 2022) (CHART 3)

While there is an argument to be made that the longer-term outlook remains bearish, it is important to note the delineation between a longer-term bullish or bearish perspective: 21.4500/21.6800. This area represents former support (now resistance) of the multi-year sideways range carved out after the start of the coronavirus pandemic. A return back above this range would suggest that the bearish breakout in 2022 failed, and thus a more constructive outlook – through 2023 – would be appropriate.
IG CLIENT SENTIMENT INDEX: SILVER PRICE FORECAST (October 5, 2022) (CHART 4)
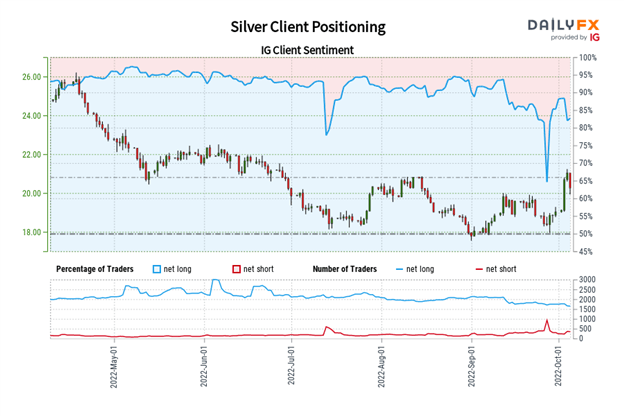
Silver: Retail trader data shows 84.67% of traders are net-long with the ratio of traders long to short at 5.52 to 1. The number of traders net-long is 3.95% lower than yesterday and 7.32% lower from last week, while the number of traders net-short is 17.56% lower than yesterday and 14.41% lower from last week.
We typically take a contrarian view to crowd sentiment, and the fact traders are net-long suggests Silver prices may continue to fall.
Traders are further net-long than yesterday and last week, and the combination of current sentiment and recent changes gives us a stronger Silver-bearish contrarian trading bias.
Trade Smarter - Sign up for the DailyFX Newsletter
Receive timely and compelling market commentary from the DailyFX team
--- Written by Christopher Vecchio, CFA, Senior Strategist


