Silver Price Forecast Overview:
- Silver prices have started to resume their multi-month uptrend, commencing with the bullish breakout from the triangle that produced consolidated trading in August.
- Elevated silver volatility in context of broader market conditions (strength in equity markets, weakness in the US Dollar) may prove to be beneficial for silver prices.
- Recent changes in sentiment suggests that silver prices have a mixed outlook in the short-term.
Silver Prices Resume Upward March
Gyrations in silver prices in August may have been the result of an overcrowded market, as previous iterations of this report have explained. Like with gold prices, that there was a deeper pullback in silver prices in August amid a more restrained rise in US Treasury yields relative to June suggests that the long silver trade was overcrowded.
But August is coming to an end, and with it, so too the summer doldrums. Market participation rates will be rising over the coming weeks, especially after next Monday’s Labor Day holiday in the United States. Alongside more participation means more volume, which lends to the possibility of more volatility (note: October is the month that produces the highest average VIX, historically speaking).
That also means that attention will return to the bullish fundamental argument that has lifted silver prices for several months now. It has been and remains the case that the base case scenario of expansion fiscal and expansionary monetary policies will an environment for falling real yields, which historically has been beneficial to precious metals like silver prices. These factors should continue to enhance the negative real yield argument that has been fueling gold and silver’s rallies in recent months.
Silver Prices and Silver Volatility Syncing Back Up
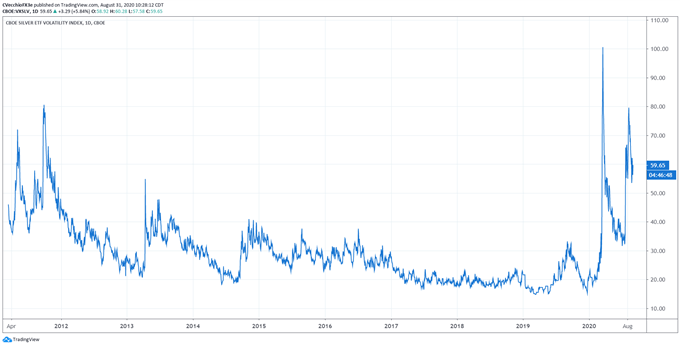
Silver volatility (as measured by the Cboe’s gold volatility ETF, VXSLV, which tracks the 1-month implied volatility of silver as derived from the SLV option chain) was trading at 59.65, sitting closer to the monthly low (52.83) than the monthly high (83.31), effectively carving out a doji candle on the monthly timeframe. The 5-day correlation between VXSLV and silver prices is 0.67 and the 20-day correlation is 0.24. One week ago on August 24, the 5-day correlation was 0.61 and the 20-day correlation was 0.55.
VXSLV (SILVER VOLATILITY) TECHNICAL ANALYSIS: DAILY PRICE CHART (MARCH 2011 TO August 2020) (CHART 1)

As we’ve explained previously, given the current environment, falling silver volatility is not necessarily a negative development for silver prices, whereas rising silver volatility has almost always proved bullish; in the same vein, silver volatility simply trending sideways is more positive than negative for silver prices.
Both gold and silver are precious metals that typically enjoy a safe haven appeal during times of uncertainty in financial markets. While other asset classes don’t like increased volatility (signaling greater uncertainty around cash flows, dividends, coupon payments, etc.), precious metals tend to benefit from periods of higher volatility as uncertainty increases silver’s safe haven appeal.


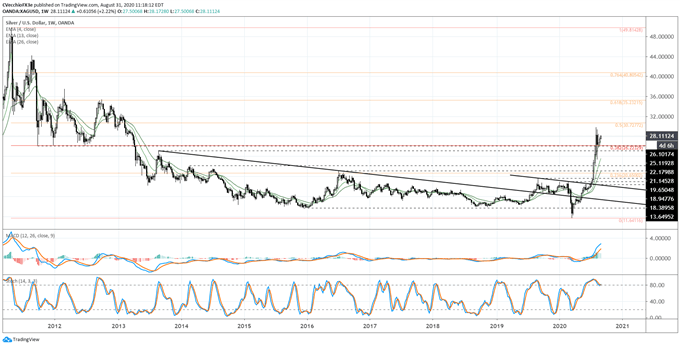
SILVER PRICE TECHNICAL ANALYSIS: WEEKLY CHART (JUNE 2013 TO AUGUST 2020) (CHART 2)

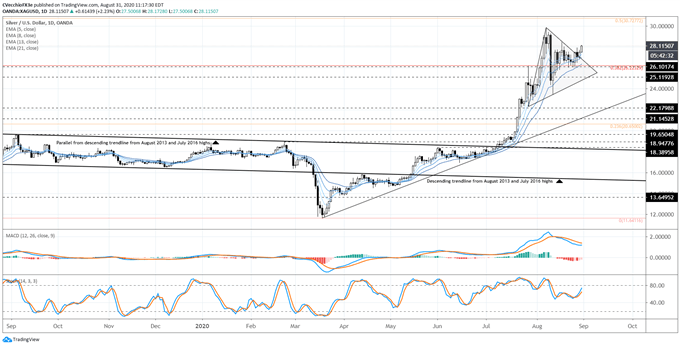
In the most recent silver price forecast, it was noted “that silver prices rallied into the consolidation amid a long-term bottoming effort suggests that a bull flag has formed; a topside breakout above 29.8588 is favored.” It appears that the bull flag morphed into a triangle consolidation, yielding a topside break last week with follow through on the final trading day of August. Silver prices have proven to be supported by the daily 21-EMA during recent selloffs, and now has the fully daily 5-, 8-, 13-, and 21-EMA in bullish sequential order. The bullish breakout attempt favors a return to the yearly high at 29.8588.
SILVER PRICE TECHNICAL ANALYSIS: DAILY CHART (AUGUST 2019 TO AUGUST 2020) (CHART 3)

Silver prices may be resuming their long-term bottoming effort. Silver prices have held above their weekly 4-, 13-, and 26-EMA envelope, with the weekly 4-EMA serving as critical support through August. But more notably, silver prices maintained their move above the 38.2% retracement of the 2011 high to 2020 low range at 26.2233, which also constitutes key support back from 2011 and 2012 on multiple occasions. Psychologically, holding above 26.2233 signal confidence in silver’s longer-term bullish bottoming prospects.
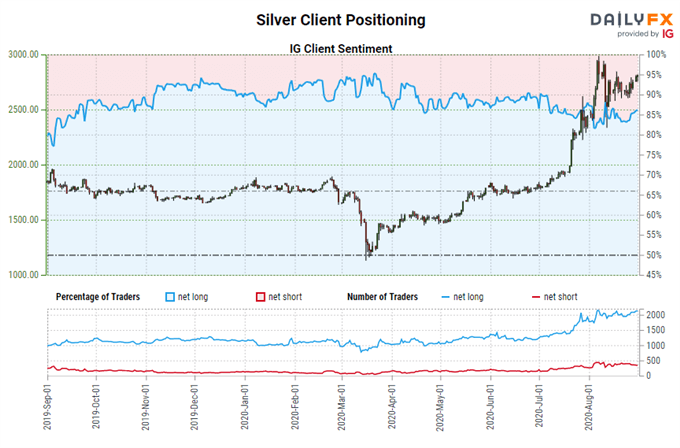
IG Client Sentiment Index: Silver Price Forecast (August 31, 2020) (Chart 4)

Silver: Retail trader data shows 85.21% of traders are net-long with the ratio of traders long to short at 5.76 to 1. The number of traders net-long is 5.44% higher than yesterday and 6.31% higher from last week, while the number of traders net-short is 8.57% higher than yesterday and 5.94% lower from last week.
We typically take a contrarian view to crowd sentiment, and the fact traders are net-long suggests Silver prices may continue to fall.
Positioning is less net-long than yesterday but more net-long from last week. The combination of current sentiment and recent changes gives us a further mixed Silver trading bias.


--- Written by Christopher Vecchio, CFA, Senior Currency Strategist


