


Gold/Silver Technical Highlights:
- Gold price moving towards support, August t-line next if broken
- Silver working lower towards neckline of H&S pattern
DailyFX has created a library of guides, including fresh Q2 Forecasts, to help traders of all levels navigate the markets, check them out today on the Trading Guides page.
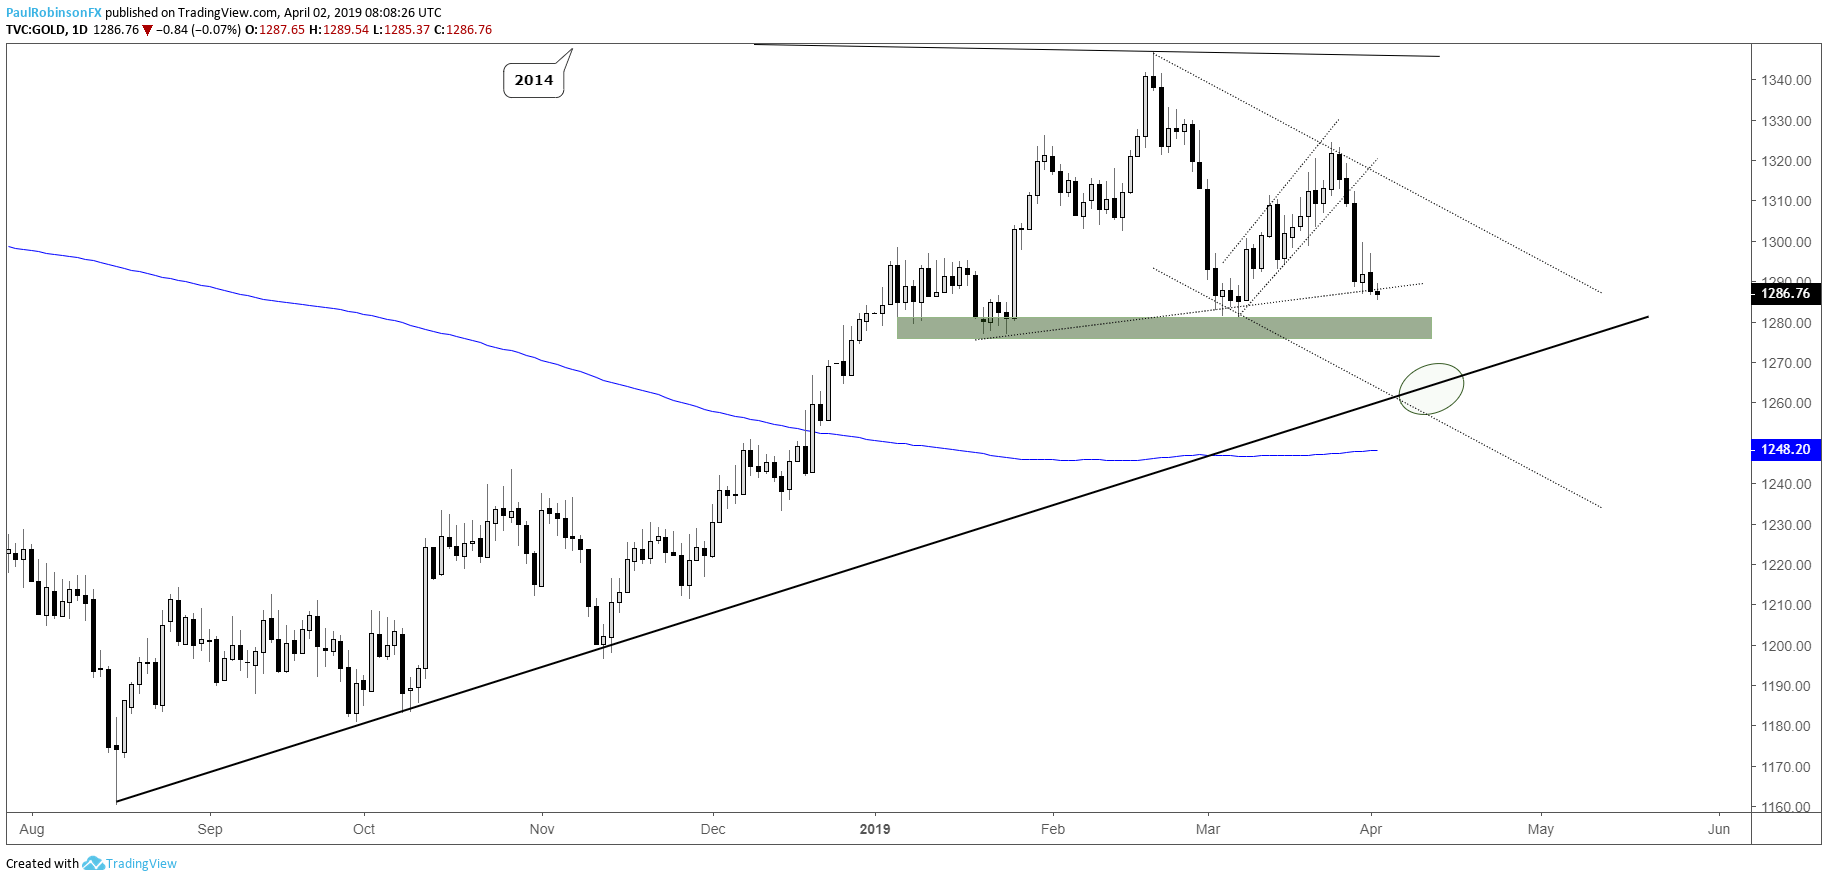
Gold price moving towards support, August t-line next if broken
Last week, gold snapped the upward corrective channel that kept it guided higher for about three weeks. The break was hard and with it no bounce has resulted in its wake. This has in focus a minor trend-line support and a pair of lows from January and March.
A drop below 1276 puts gold in the clear to trade down to the trend-line off the August low, the first major line of support during the bearish sequence off the Feb high. Depending on the timing the August trend-line could be in confluence with the lower parallel tied to the Feb high trend-line, adding a bit more weight to the area in the low-1260s.
For now, continuing to stay on the bearish side makes sense but traders need to be cognizant that support here soon may hold, even if only temporarily. Longs don’t hold any appeal as support has yet to show any interest from buyers.
Check out the IG Client Sentiment page to see how changes in trader positioning can help signal the next price move in gold and other major markets and currencies.
Gold Daily Chart (Break of support, t-line next?)
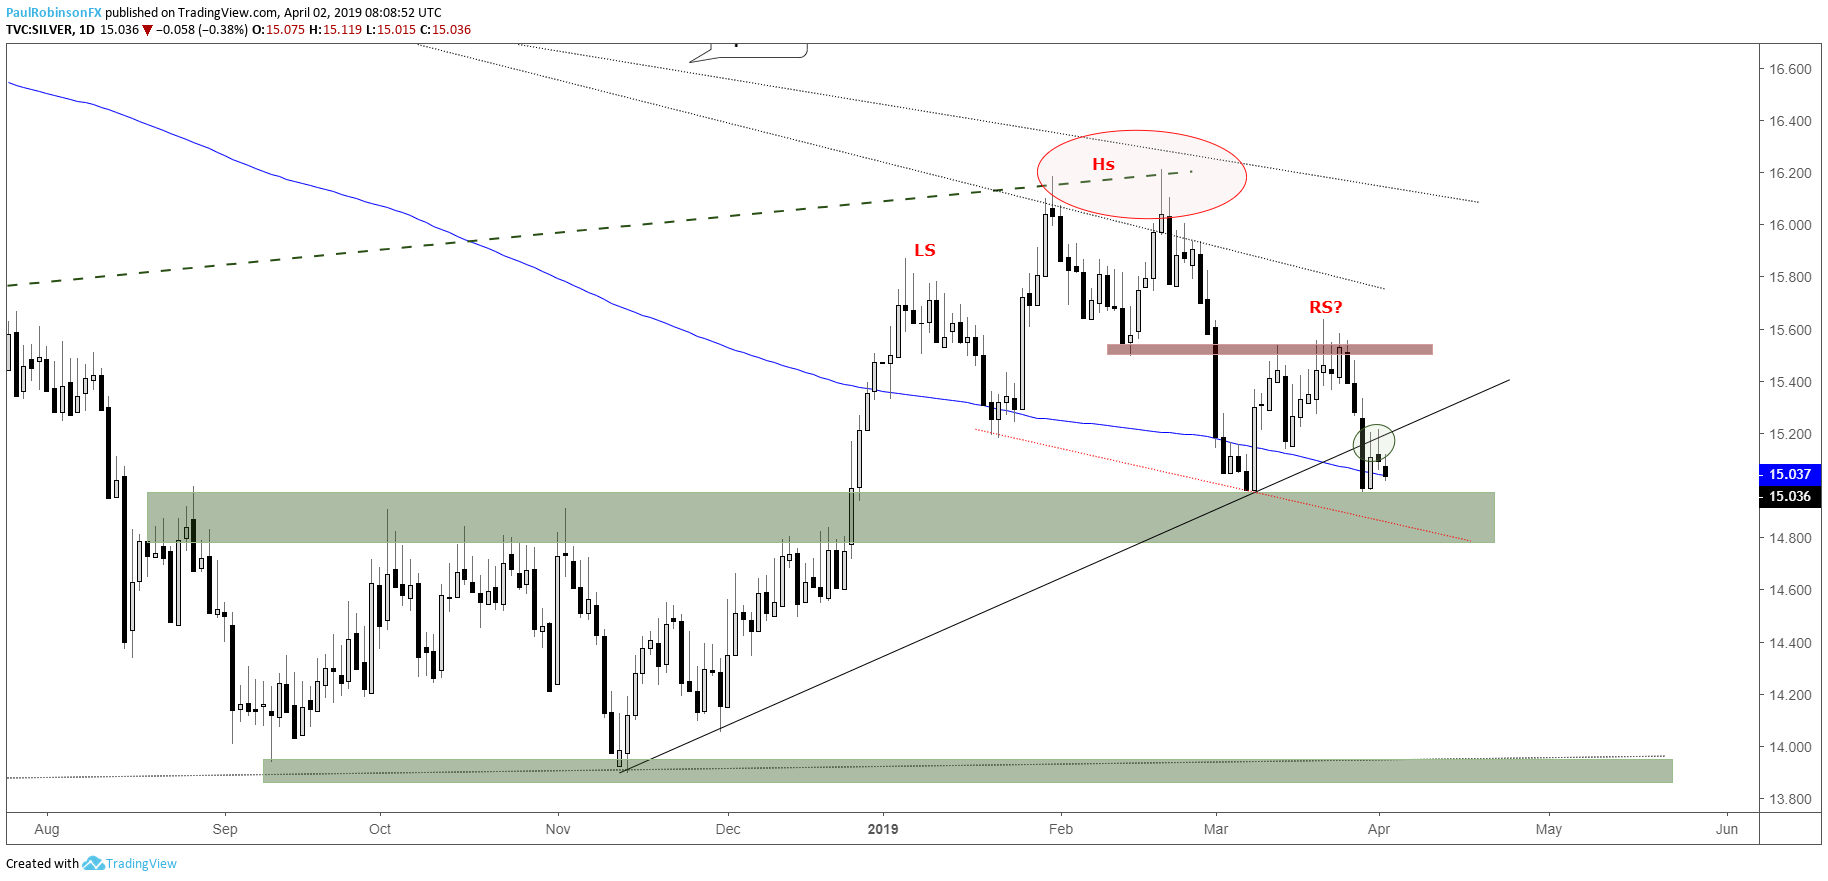
Silver working lower towards neckline of H&S pattern
Silver broke the November trend-line last week and is currently hanging on by a thread around the 200-day and monthly low. With a little more weakness, the neckline of the head-and-shoulders pattern in development since January could finally get snapped.
In confluence with the neckline is the top of the range that dominated trade from August to December. It’s support until broken, but a break below both thresholds (<14.70 to be safe) should have silver rolling downhill, perhaps with a full head of steam as significant support is lacking until near the 14-mark.
Silver Daily Chart (Trading towards neckline test)
Resources for Forex & CFD Traders
Whether you are a new or experienced trader, we have several resources available to help you; indicator for tracking trader sentiment, quarterly trading forecasts, analytical and educational webinars held daily, trading guides to help you improve trading performance, and one specifically for those who are new to forex.
---Written by Paul Robinson, Market Analyst
You can follow Paul on Twitter at @PaulRobinsonFX


