


What’s inside:
- Silver prices still failing to climb above confluence of resistance
- Short-term triangle suggests a move is coming
- Precious metals holding up past couple of sessions despite dollar strength, what to make of it; not much, yet
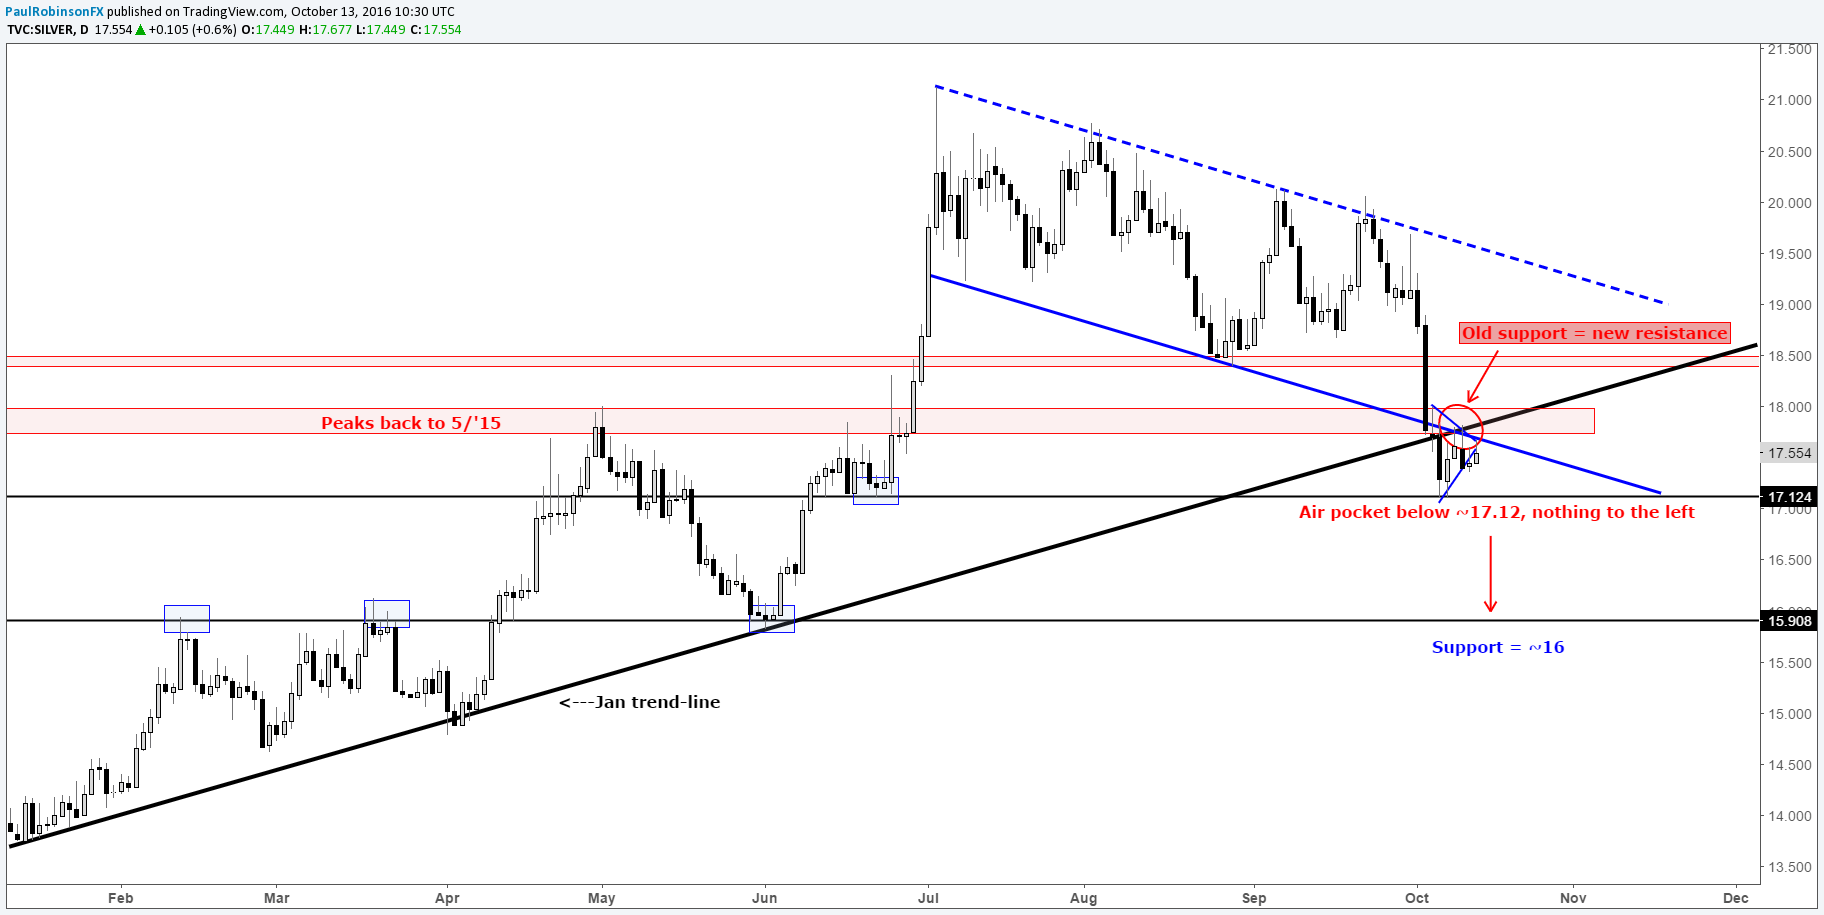
In the past couple of posts, we have been discussing the importance of watching how silver prices (and gold) react following the late Sep, early Oct decline. The retracement so far has been capped by the upper 17s, an area we’ve put focus on as key resistance given the confluence of technical events (Jan trend-line; peaks back to May ’15; lower multi-month parallel).
Silver: Daily
Created with Tradingview
Pulling in closer, on the hourly chart, price action is coiling itself into a tightly formed triangle. How it breaks from here will shape our short-term trading plan. The direction of the trend is down, making the likelihood the pattern will resolve to the down-side higher than the prospect of seeing an upside break. However, as per usual, because these patterns are a signal of an imminent expansion in volatility and can break in either direction, we need to wait for the trigger above or below the intersecting trend-lines.
A break lower will bring the prior low at 17.12 into play, and a drop below there will put silver into an air pocket with no visible price support until around the 16 line.
If a top-side break unfolds, silver will face resistance again in the 17.80s, but could run a bit higher into the 18s before the previously mentioned confluence of resistance is hurdled. Even then, silver will still be poorly postured from a trend standpoint.
Silver: Hourly

Created with Tradingview
The US dollar (DXY) has continued to run following its strong break above a 10-month trend-line, moving to a 7-month high in the past couple of sessions. Precious metals have held up, though, despite downward pressure by the dollar. The 21-day correlation between silver and the DXY is at a strongly negative 84%, but correlation doesn’t account for magnitude of price movements between the two, only their directional relationship. So the question: Is this a sign of a relative strength set to lead to a rebound on the first hint of dollar weakness, or simply a matter of short-term exhaustion in silver where for a moment it is living in its own little bubble? It’s important not to get overly caught up in correlations from day-to-day, but worth noting should something else point to a breakdown in the relationship.
For more on the dollar/silver relationship, see Tuesday's piece: "Silver Prices Cooling Off, Dollar Heating Up".
Back to the triangle formation...
To make things simple,we will simply go with the flow of the break. If silver breaks lower, then the bias remains pointed firmly lower. If it breaks out to the upside we will run with that, but will tread more cautiously with a long given the staunch resistance not far above.
Our Q4 forecasts are out for FX, commodities, and equity indices; you can check them out in our free trading guides section. There are other helpful guides in there as well.
---Written by Paul Robinson, Market Analyst
To receive Paul’s analysis directly via email, please SIGN UP here.
You can follow Paul on Twitter at @PaulRobinonFX.


