


Crude Oil Outlook:
- The Saudi Energy Minister said that OPEC+ could cut oil production to correct imbalances in the futures market.
- The downtrend from the June and July swing highs has broken, and crude oil prices are trading above their daily 21-EMA (one-month moving average) for the first time since June 16.
- According to the IG Client Sentiment Index, crude oil prices have a bullish bias in the near-term.
Trade Smarter - Sign up for the DailyFX Newsletter
Receive timely and compelling market commentary from the DailyFX team
Supply Concerns in Focus
As the global energy supply crisis gets worse – particularly for Europe – OPEC+ sparked oil markets yesterday with news of a potential production cut. Saudi Arabian Energy Minister Prince Abdulaziz bin Salman noted that the futures market is dealing with poor liquidity, which is provoking a distorted view of the tight supply picture.
In other words, crude oil prices are too low, and it may be the case that a production cut by OPEC+ becomes more likely if a new Iranian nuclear deal is achieved.
The shift in the fundamental perception around crude oil prices – ignoring recession concerns in the US and the demand slowdown in China – is helping spark a meaningful technical turnaround.

Oil Volatility, Oil Price Correlation Remains Negative
Crude oil prices have a relationship with volatility like most other asset classes, especially those that have real economic uses – other energy assets, soft and hard metals, for example. Similar to how bonds and stocks don’t like increased volatility – signaling greater uncertainty around cash flows, dividends, coupon payments, etc. – crude oil tends to suffer during periods of higher volatility. Crude oil volatility dropping back is proving supportive of the recent rise in crude oil prices.
OVX (Oil Volatility) Technical Analysis: Daily Price Chart (August 2021 to August 2022) (Chart 1)
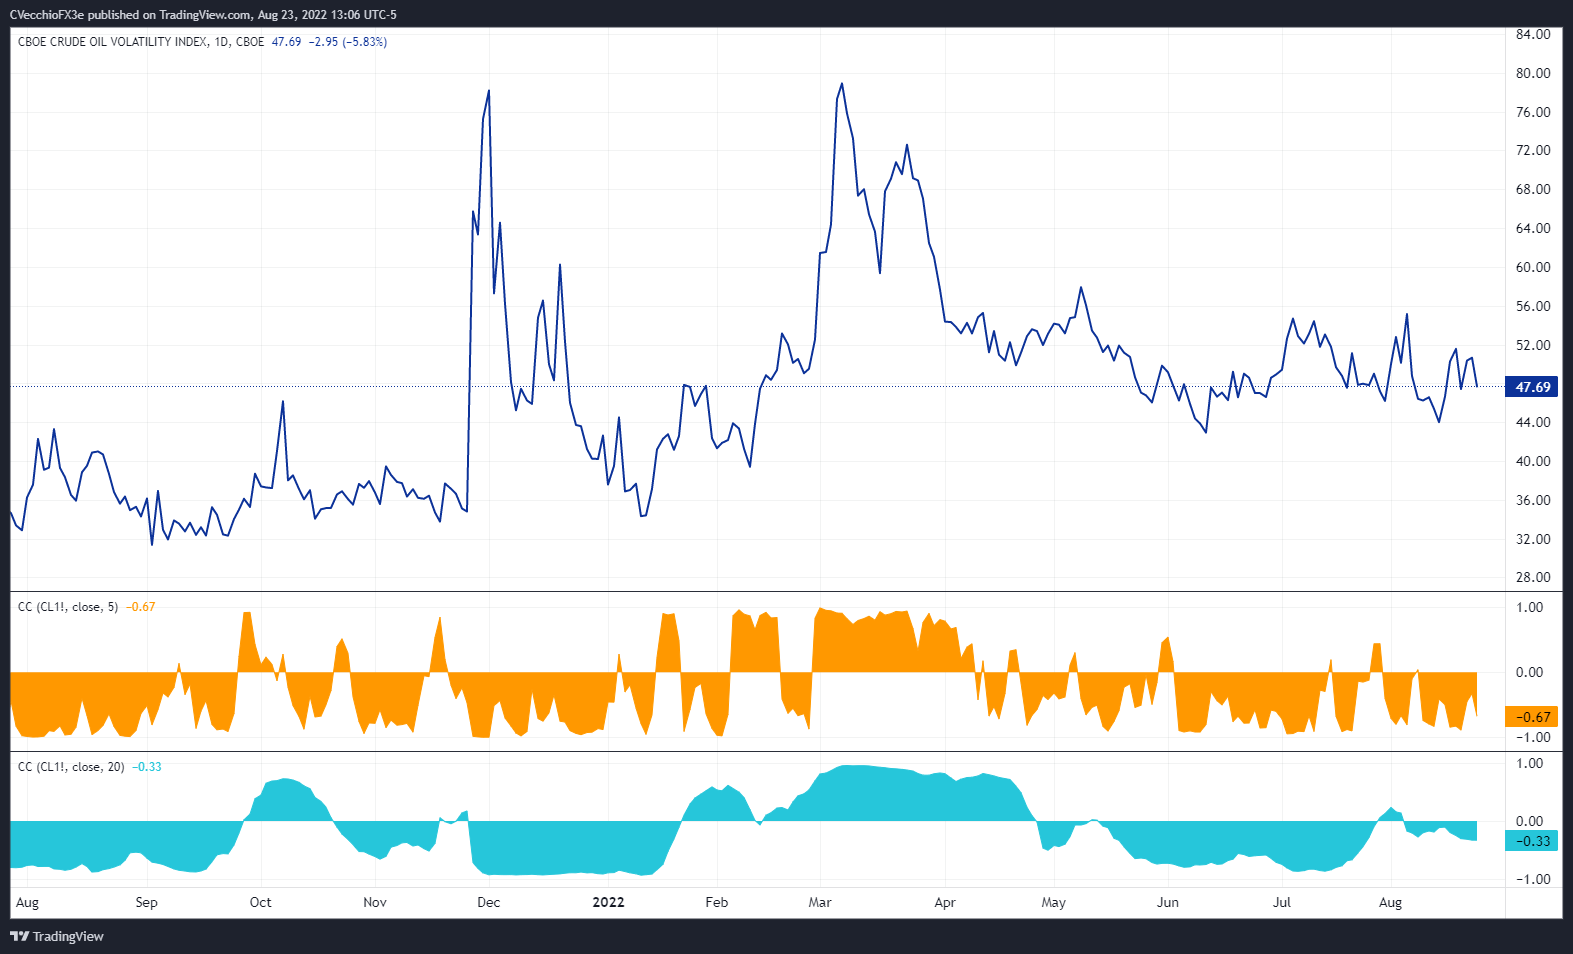
Oil volatility (as measured by the Cboe’s gold volatility ETF, OVX, which tracks the 1-month implied volatility of oil as derived from the USO option chain) was trading at 47.69 at the time this report was written. The 5-day correlation between OVX and crude oil prices is -0.67 while the 20-day correlation is -0.33. One week ago, on August 16, the 5-day correlation was -0.84 and the 20-day correlation was -0.20.

Crude Oil Price Technical Analysis: Daily Chart (August 2021 to August 2022) (Chart 2)
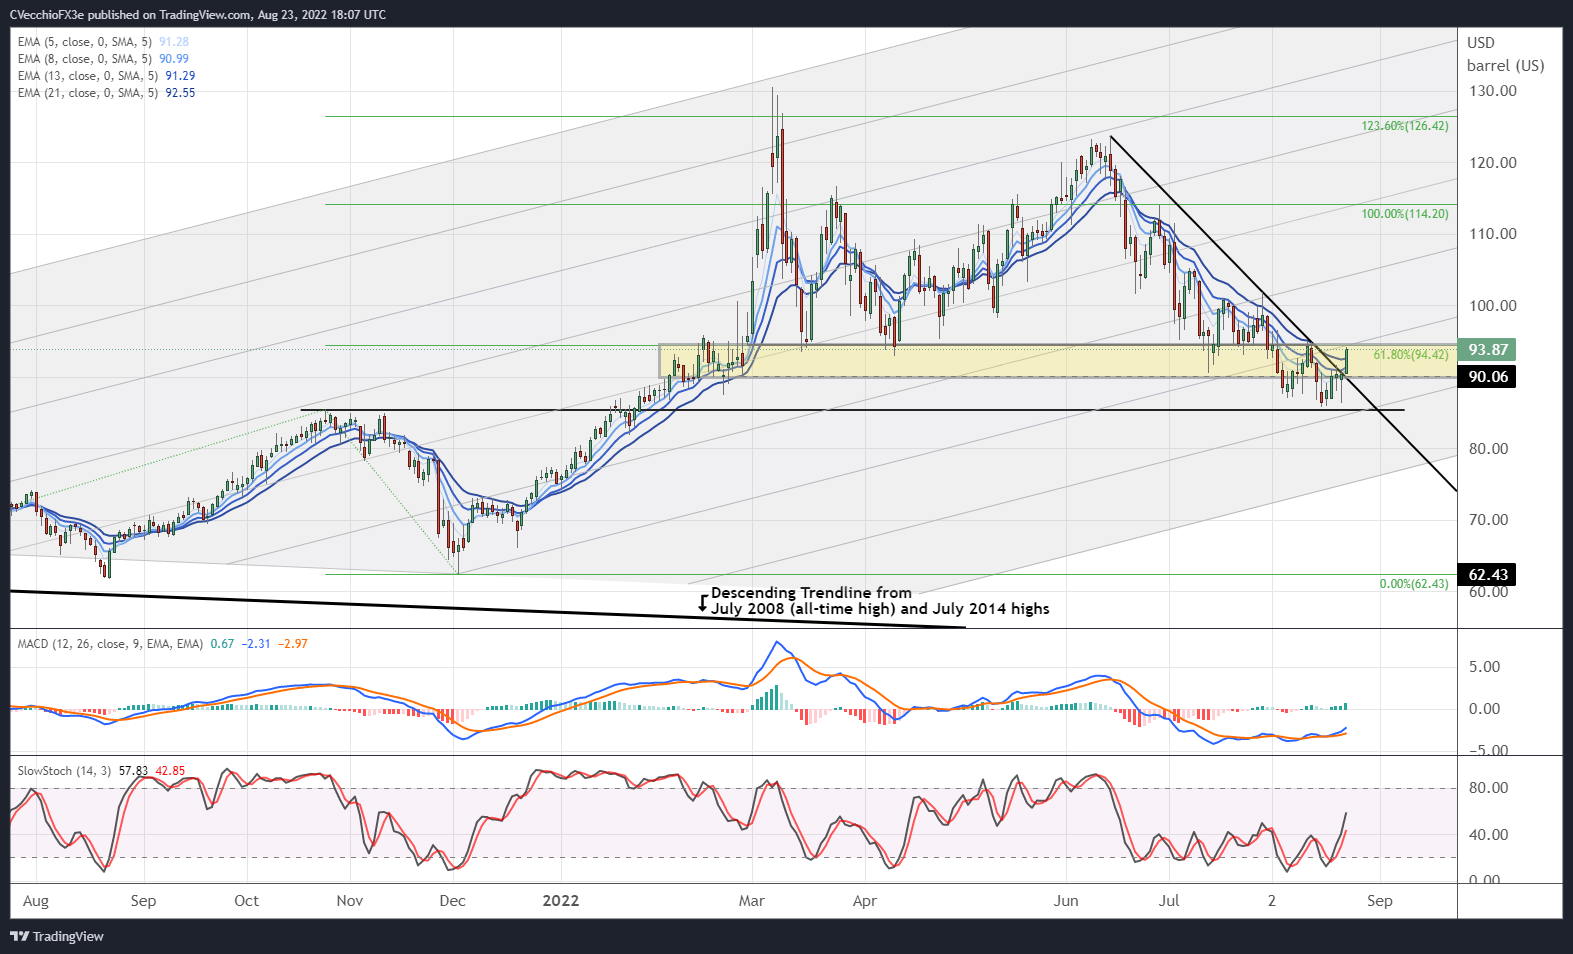
Crude oil prices are attempting to break the downtrend from the mid-June and late-July swing highs, and in turn are working on their first daily close above their daily 21-EMA (one-month moving average) since June 16. Momentum is turning bullish, with crude oil prices above their daily 5-, 8-, 13-, and 21-EMA envelope, which is in neither bearish nor bullish sequential order. Daily MACD is rising albeit still below its signal line, while daily Slow Stochastics have moved above their median line. Consistent with previous commentary that “a move above the daily 21-EMA would…offer the greatest confidence that the sell-off has finished,” it is possible that crude oil prices are on the precipice of their next leg higher.
Crude Oil Price Technical Analysis: Weekly Chart (March 2008 to August 2022) (Chart 3)
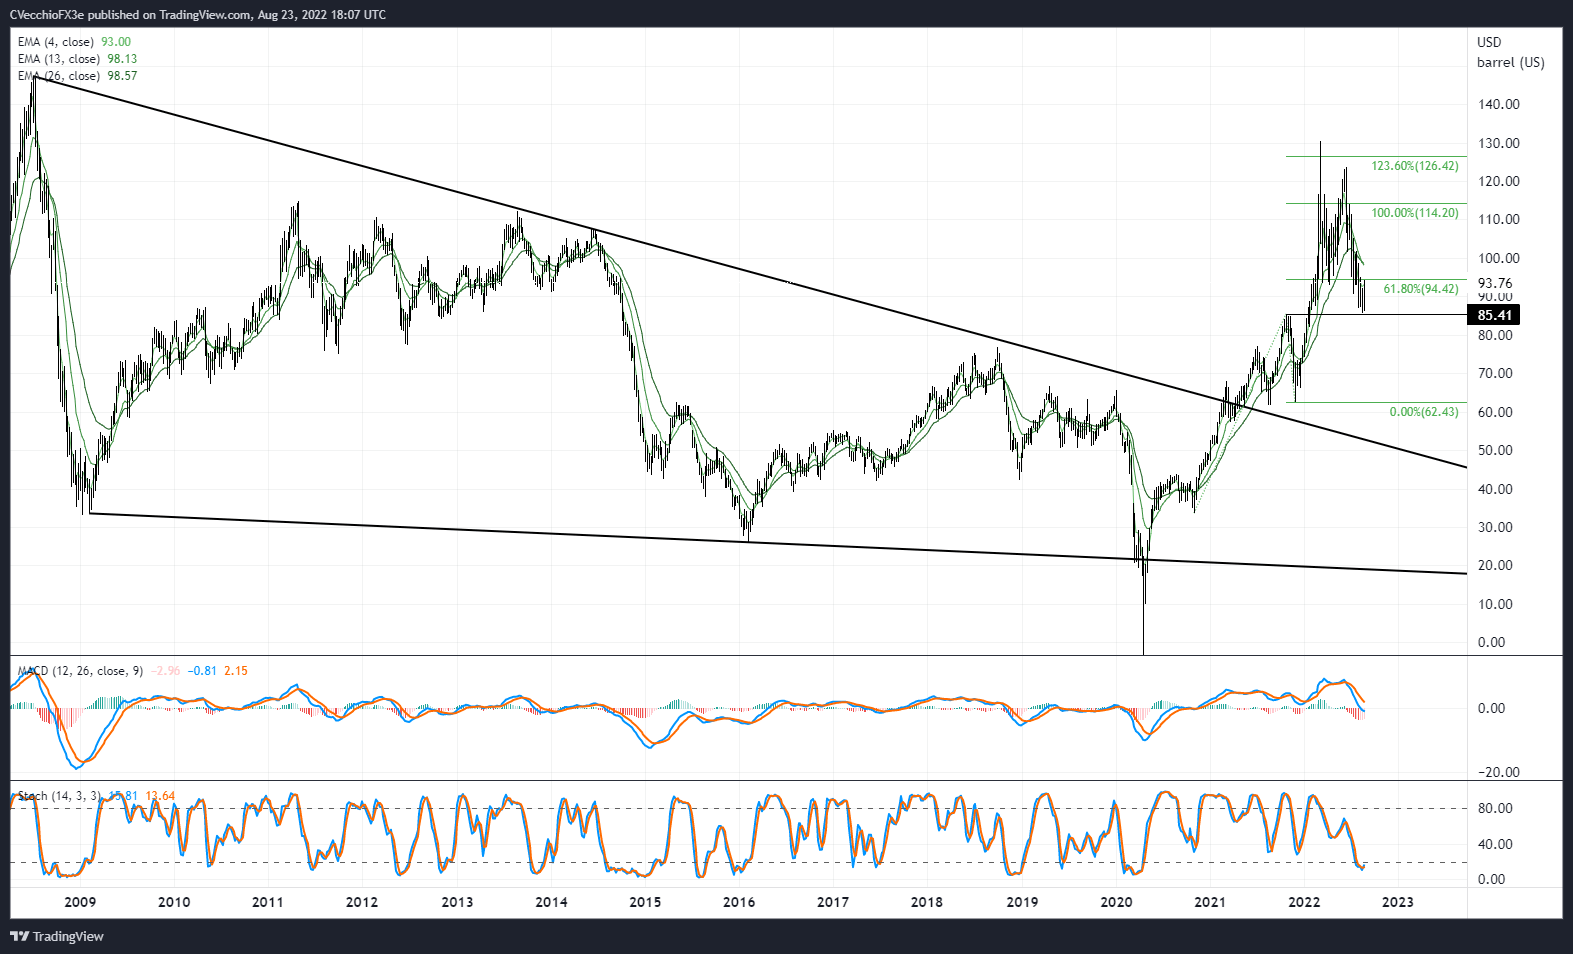
Bearish momentum has started to ease on the weekly timeframe as well. Crude oil prices are working on their first close above their weekly 4-EMA for the first time since the week of June 6, though remain below their weekly 8- and 13-EMAs. Weekly MACD’s decline is beginning to abate, potentially staving off a drop below its signal line, while weekly Slow Stochastics are on the verge of exiting oversold territory. A weekly close above the weekly 4-EMA at 93.00 would help reinforce the bullish technical reversal narrative.

IG CLIENT SENTIMENT INDEX: CRUDE OIL PRICE FORECAST (August 23, 2022) (CHART 4)
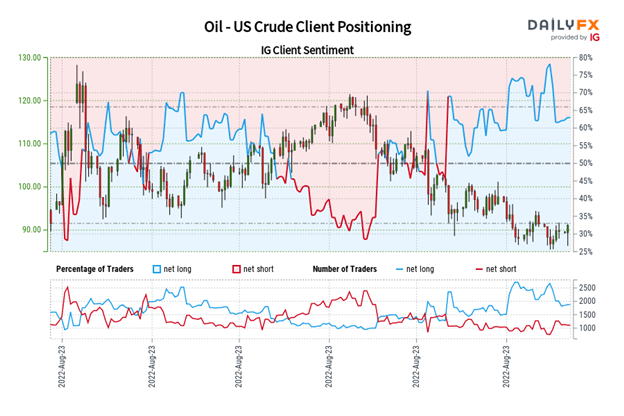
Oil - US Crude: Retail trader data shows 63.19% of traders are net-long with the ratio of traders long to short at 1.72 to 1. The number of traders net-long is 1.28% lower than yesterday and 8.50% lower from last week, while the number of traders net-short is 29.10% higher than yesterday and 36.36% higher from last week.
We typically take a contrarian view to crowd sentiment, and the fact traders are net-long suggests Oil - US Crude prices may continue to fall.
Yet traders are less net-long than yesterday and compared with last week. Recent changes in sentiment warn that the current Oil - US Crude price trend may soon reverse higher despite the fact traders remain net-long.
Trade Smarter - Sign up for the DailyFX Newsletter
Receive timely and compelling market commentary from the DailyFX team
--- Written by Christopher Vecchio, CFA, Senior Strategist


