


Crude Oil Outlook:
- Crude oil prices can’t seem to catch a bid, setting freshly monthly lows in today’s session.
- The downtrend from the June and July swing highs remains in place, but support may be nearing around 85.41, the October 2021 high.
- According to the IG Client Sentiment Index, crude oil prices have a mixed bias in the near-term.

Growth & Supply Concerns
Crude oil prices are taking another dive lower today on the back of renewed concerns about supply and demand. On the demand side, news that the People’s Bank of China cut a key interest rate for only the second time this year stoked worries that the world’s second largest economy is in worse shape than previously believed. On the supply side, there are signs of progress towards a revitalized Iran nuclear deal, which would bring Iranian oil back to the market.
The one-two punch of weaker Chinese demand plus increased Iranian supply has helped drive crude oil prices to a fresh August low, and their lowest level since the Russian invasion of Ukraine began in February. The technical picture isn’t faring any better, with the downtrend in place since the June high remaining.
Oil Volatility, Oil Price Correlation More Negative
Crude oil prices have a relationship with volatility like most other asset classes, especially those that have real economic uses – other energy assets, soft and hard metals, for example. Similar to how bonds and stocks don’t like increased volatility – signaling greater uncertainty around cash flows, dividends, coupon payments, etc. – crude oil tends to suffer during periods of higher volatility. As is often the case, the uptick in crude oil volatility has proved negative for crude oil prices in the near-term.
OVX (Oil Volatility) Technical Analysis: Daily Price Chart (August 2021 to August 2022) (Chart 1)

Oil volatility (as measured by the Cboe’s gold volatility ETF, OVX, which tracks the 1-month implied volatility of oil as derived from the USO option chain) was trading at 50.33 at the time this report was written. The 5-day correlation between OVX and crude oil prices is -0.85 while the 20-day correlation is -0.20. One week ago, on August 9, the 5-day correlation was -0.74 and the 20-day correlation was -0.20.

Crude Oil Price Technical Analysis: Daily Chart (August 2021 to August 2022) (Chart 2)
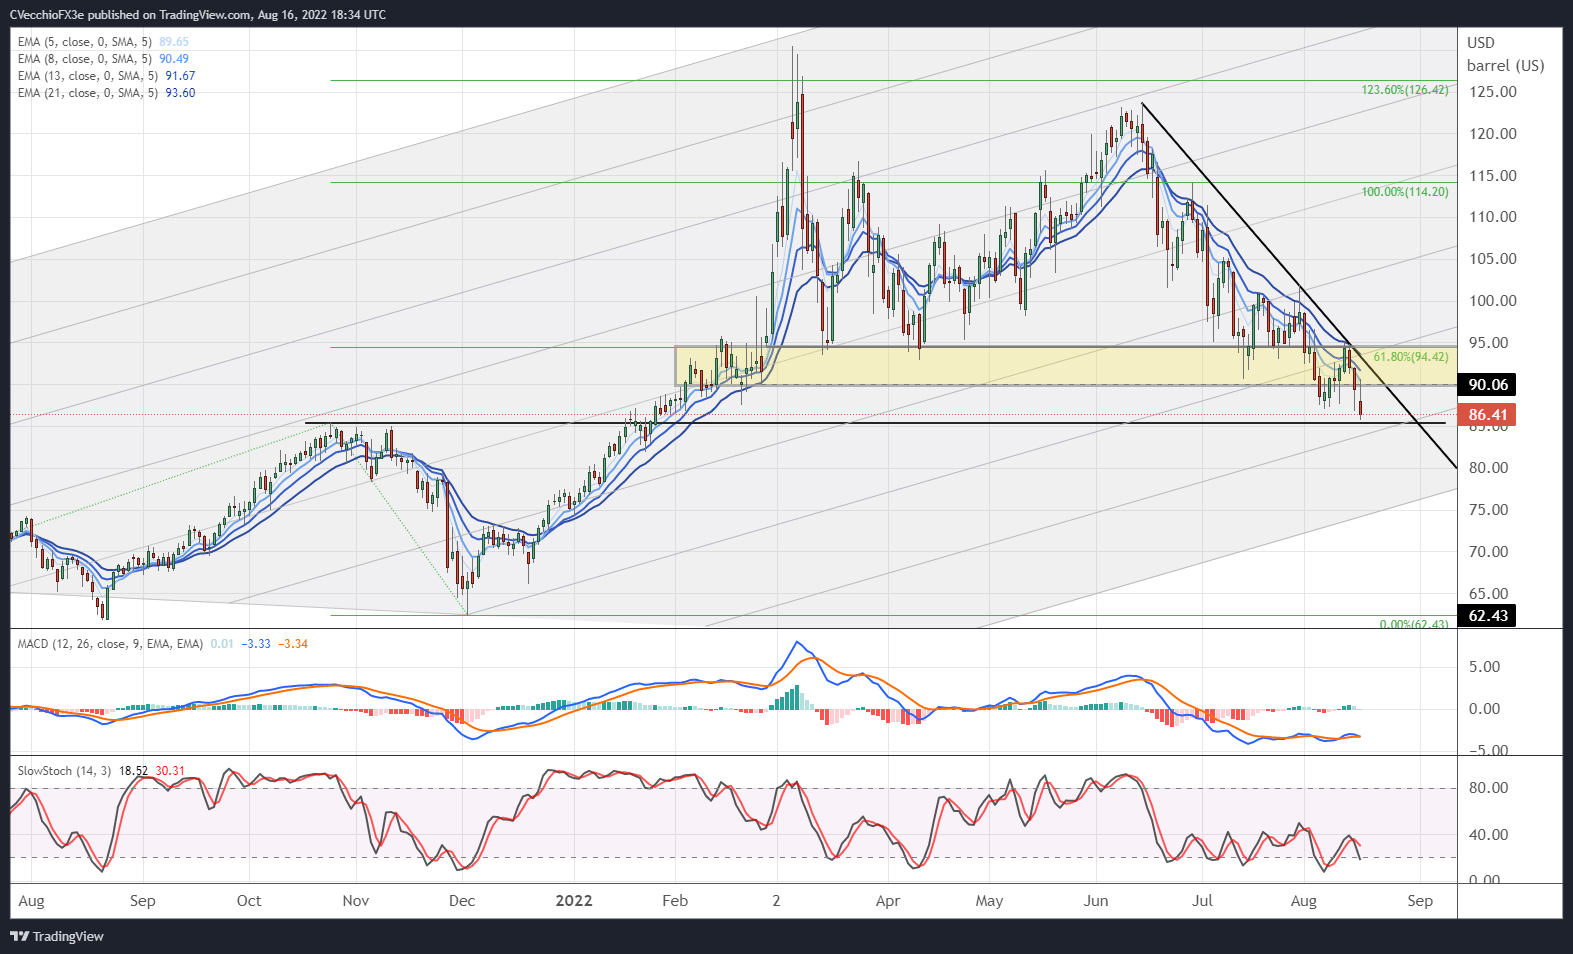
Crude oil prices made an earnest attempt at retaking their daily 21-EMA (one-month moving average) last week for the first time since mid-June, only to be rebuffed by the descending trendline from the mid-June and late-July swing highs. Momentum is increasingly bearish, with crude oil prices below their daily 5-, 8-, 13-, and 21-EMA envelope, which is in bearish sequential order. Daily MACD has just issued a bearish crossover while below its signal line, while daily Slow Stochastics are nearing a return to oversold territory. Support is nearing around 85.41, where the October 2021 high was carved out. It remains the case, as noted at the end of July, that “a move above the daily 21-EMA would…offer the greatest confidence that the sell-off has finished…until then, however, more downside remains a distinct possibility.”
Crude Oil Price Technical Analysis: Weekly Chart (March 2008 to August 2022) (Chart 3)
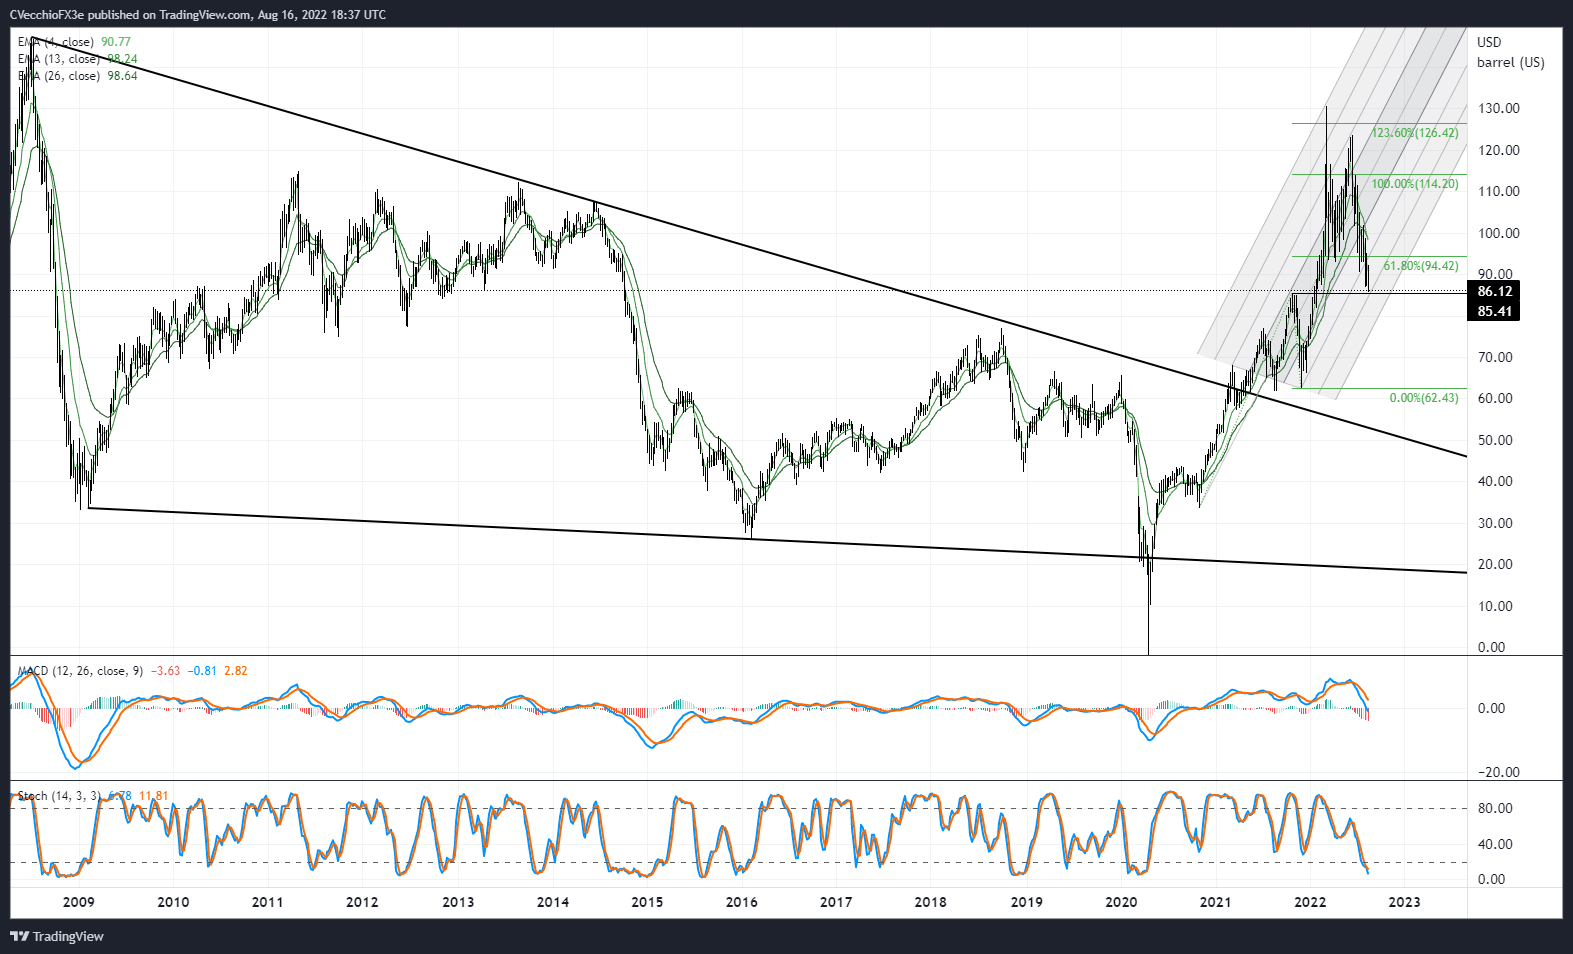
Momentum has weakened further on the weekly timeframe. Crude oil prices are below their weekly 4-, 8-, and 13-EMAs, and the weekly EMA envelope is in bearish sequential order. Weekly MACD continues to decline and is nearing a drop below its signal line, while weekly Slow Stochastics are now in oversold territory. A weekly close below 85.41 would suggest an even deeper setback to the low 80s would become the base case scenario.

IG CLIENT SENTIMENT INDEX: CRUDE OIL PRICE FORECAST (August 16, 2022) (CHART 4)
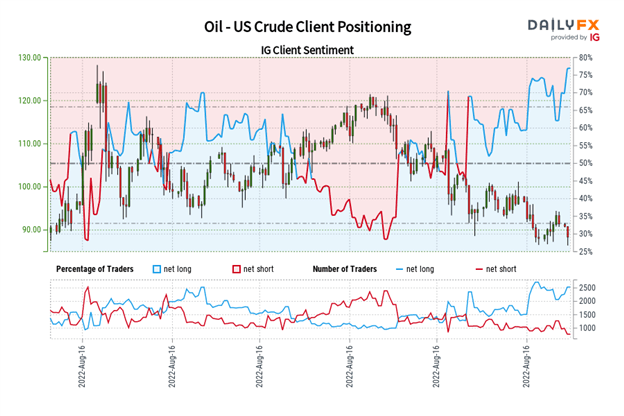
Oil - US Crude: Retail trader data shows 71.90% of traders are net-long with the ratio of traders long to short at 2.56 to 1. The number of traders net-long is 20.88% lower than yesterday and 1.95% lower from last week, while the number of traders net-short is 12.68% higher than yesterday and 15.38% lower from last week.
We typically take a contrarian view to crowd sentiment, and the fact traders are net-long suggests Oil - US Crude prices may continue to fall.
Positioning is less net-long than yesterday but more net-long from last week. The combination of current sentiment and recent changes gives us a further mixed Oil - US Crude trading bias.
Trade Smarter - Sign up for the DailyFX Newsletter
Receive timely and compelling market commentary from the DailyFX team
--- Written by Christopher Vecchio, CFA, Senior Strategist


