


Crude Oil Outlook:
- Crude oil prices are at a critical juncture, holding at support in place since late-February while beginning to challenge the downtrend from the early- and late-June swing highs.
- Technical momentum remains bearish, even if there are nascent signs that a workable low could emerge.
- According to the IG Client Sentiment Index, crude oil prices have a mixed bias in the near-term.

Biding Time
It seems an equilibrium has been reached in energy markets. Supply problems persist and don’t appear to be improving in a material way. Global energy demand continues to outpace its levels pre-pandemic, but recession concerns for Europe and North America are helping quell stronger crude oil prices (as is China’s on-again off-again zero-COVID strategy). For crude oil prices, this has meant relative stability as key technical levels are challenged, both support and resistance. Like a spring coiling, the consolidation of crude oil prices into the apex of a near-term triangle may be a harbinger of more violent price action on the horizon.
Oil Volatility, Oil Price Correlation Erodes
Crude oil prices have a relationship with volatility like most other asset classes, especially those that have real economic uses – other energy assets, soft and hard metals, for example. Similar to how bonds and stocks don’t like increased volatility – signaling greater uncertainty around cash flows, dividends, coupon payments, etc. – crude oil tends to suffer during periods of higher volatility. Declining crude oil volatility hasn’t coincided with a rebound in crude oil prices, a potentially bad omen.
OVX (Oil Volatility) Technical Analysis: Daily Price Chart (July 2021 to July 2022) (Chart 1)
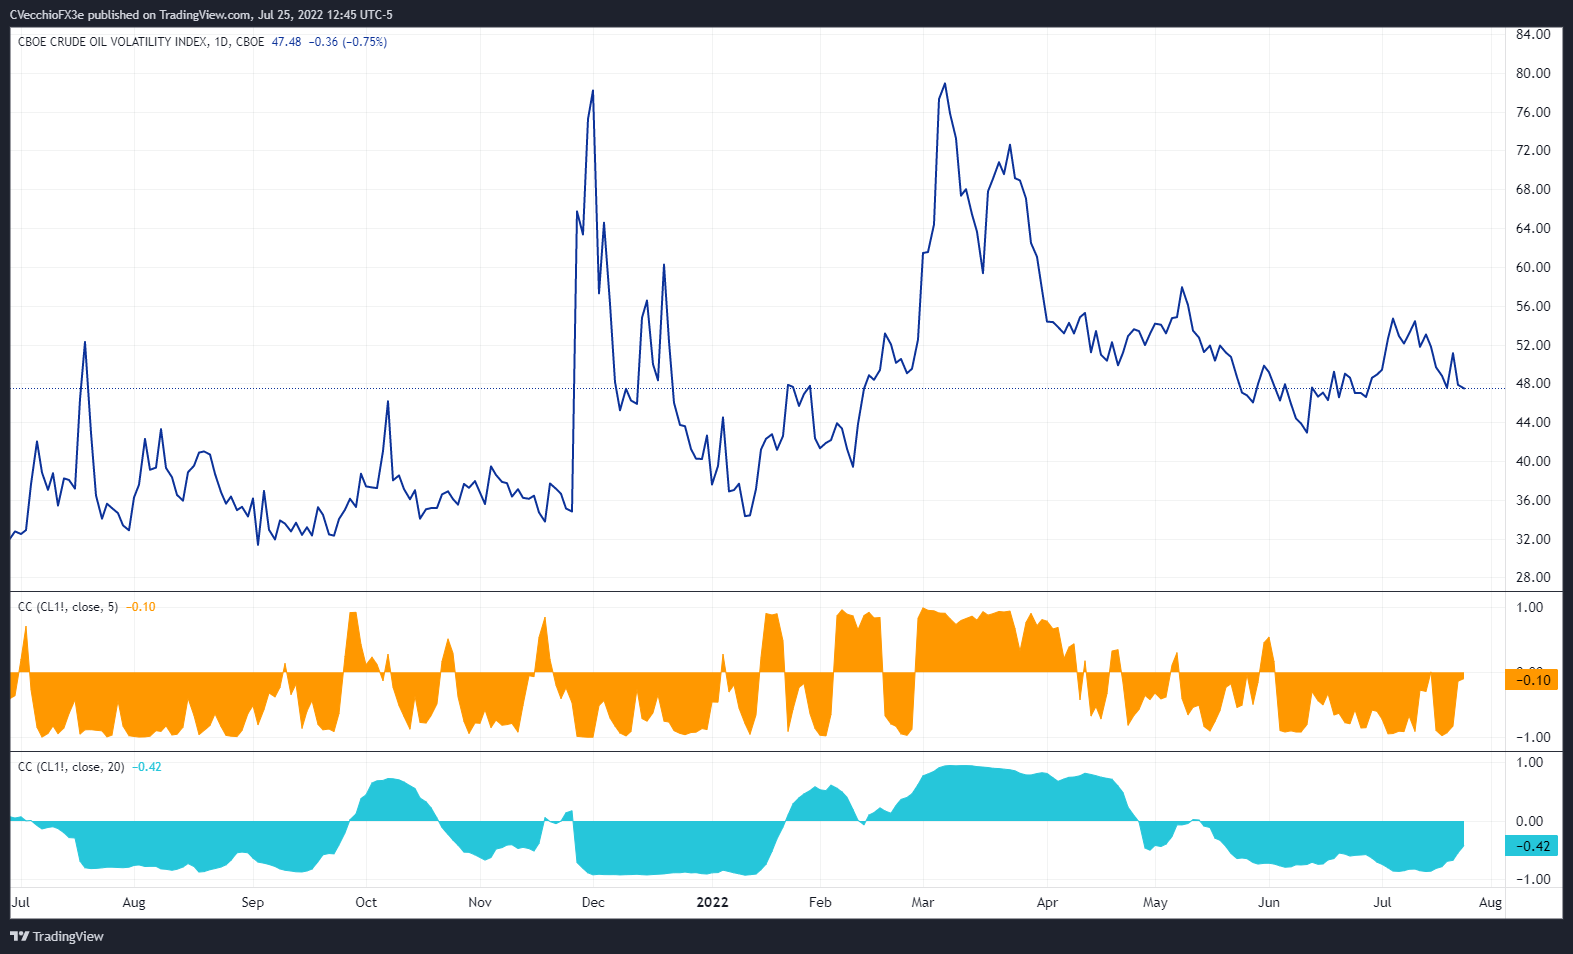
Oil volatility (as measured by the Cboe’s gold volatility ETF, OVX, which tracks the 1-month implied volatility of oil as derived from the USO option chain) was trading at 47.47 at the time this report was written, its lowest level since the last week of June. The 5-day correlation between OVX and crude oil prices is -0.10 while the 20-day correlation is -0.42. One week ago, on July 18, the 5-day correlation was -0.89 and the 20-day correlation was -0.91.

Crude Oil Price Technical Analysis: Daily Chart (July 2021 to July 2022) (Chart 2)

Crude oil prices are entering make or break territory, funneling into the apex of a triangle that’s been forming over the past few weeks. Support comes in the form of the lows carved out since the end of February, while resistance has evolved as the descending trendline from the early- and late-June swing highs. Crude oil prices are still below their daily EMA envelope, which is in bearish sequential order. Daily MACD is still trending lower deep below its signal line, and daily Slow Stochastics have started to ease below their median line.
As noted last week, “a move above the daily 21-EMA would…offer the greatest confidence that the sell-off has finished,” as it would constitute a break of the multi-week downtrend. Until then, however, more downside remains a distinct possibility.
Crude Oil Price Technical Analysis: Weekly Chart (March 2008 to July 2022) (Chart 3)
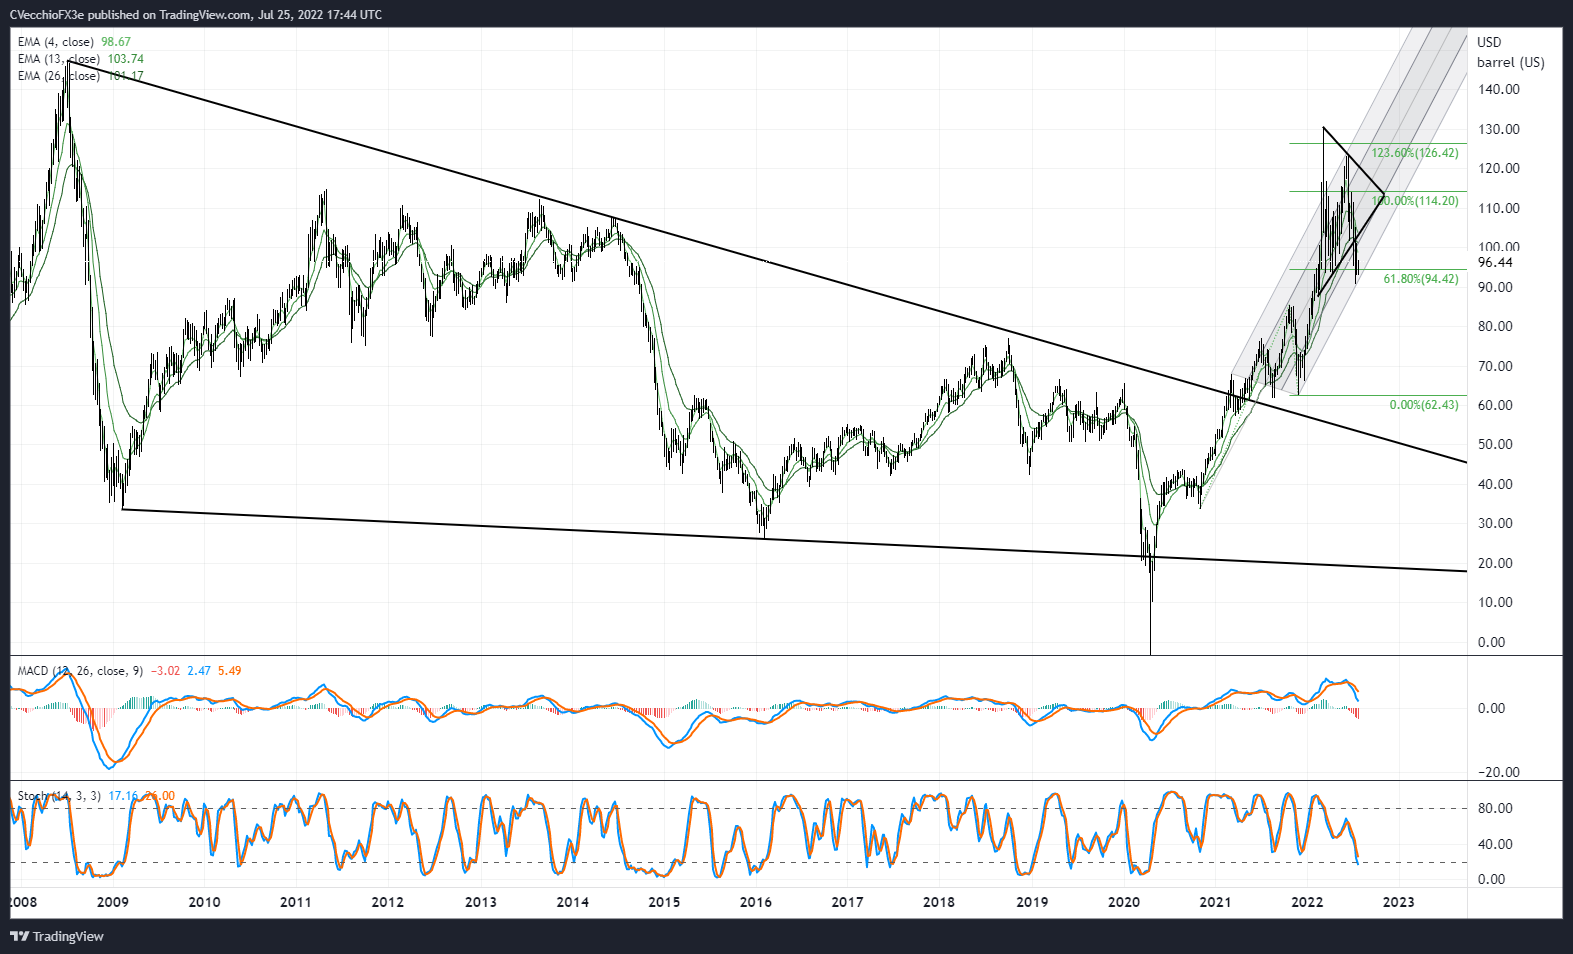
Momentum has weakened considerably on the weekly timeframe. Crude oil prices are below their weekly 4-, 8-, and 13-EMAs, and the weekly EMA envelope is in bearish sequential order. Weekly MACD continues to decline but thus far remains above its signal line, while weekly Slow Stochastics are the cusp of entering oversold territory. The resolution to the recent consolidation – either a break down through multi-month support or a break above multi-week resistance – won’t likely be reflected on the weekly timeframe until well after the fact.

IG CLIENT SENTIMENT INDEX: CRUDE OIL PRICE FORECAST (July 25, 2022) (CHART 4)
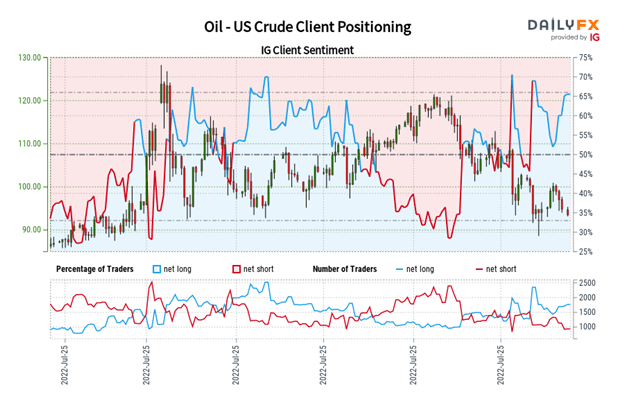
Oil - US Crude: Retail trader data shows 59.40% of traders are net-long with the ratio of traders long to short at 1.46 to 1. The number of traders net-long is 4.84% lower than yesterday and 0.95% lower from last week, while the number of traders net-short is 22.01% higher than yesterday and 3.87% lower from last week.
We typically take a contrarian view to crowd sentiment, and the fact traders are net-long suggests Oil - US Crude prices may continue to fall.
Positioning is less net-long than yesterday but more net-long from last week. The combination of current sentiment and recent changes gives us a further mixed Oil - US Crude trading bias.
Trade Smarter - Sign up for the DailyFX Newsletter
Receive timely and compelling market commentary from the DailyFX team
--- Written by Christopher Vecchio, CFA, Senior Strategist


