


Crude Oil Outlook:
- Crude oil prices have rebounded from the support zone around $94/brl last week, a floor under the market ever since Russia invaded Ukraine at the end of February.
- Technical momentum is starting to shift, but not enough to suggest that the recent sell-off has run its course.
- According to the IG Client Sentiment Index, crude oil prices have a mixed bias in the near-term.
Trade Smarter - Sign up for the DailyFX Newsletter
Receive timely and compelling market commentary from the DailyFX team
Growth Fears Peaking?
Global energy demand is running high – higher than it was at this point in 2019, prior to the pandemic – and the supply picture remains incredibly feeble. While those facts should be a strong fundamental basis for higher crude oil prices, the fact of the matter is that global growth concerns, surrounding Europe and the United States or China and its zero-COVID strategy, are proving to be a significant damper. While crude oil prices have rebounded from an important support zone carved out since late-February, it’s still too soon to suggest that the worst is over.

Oil Volatility, Oil Price Correlation Remains Weak
Crude oil prices have a relationship with volatility like most other asset classes, especially those that have real economic uses – other energy assets, soft and hard metals, for example. Similar to how bonds and stocks don’t like increased volatility – signaling greater uncertainty around cash flows, dividends, coupon payments, etc. – crude oil tends to suffer during periods of higher volatility. The recent decline in oil volatility has proved good news for crude oil prices.
OVX (Oil Volatility) Technical Analysis: Daily Price Chart (July 2021 to July 2022) (Chart 1)

Oil volatility (as measured by the Cboe’s gold volatility ETF, OVX, which tracks the 1-month implied volatility of oil as derived from the USO option chain) was trading at 48.50 at the time this report was written, its lowest level since the last week of June. The 5-day correlation between OVX and crude oil prices is -0.97 while the 20-day correlation is -0.78. One week ago, on July 12, the 5-day correlation was -0.91 and the 20-day correlation was -0.83.

Crude Oil Price Technical Analysis: Daily Chart (July 2021 to July 2022) (Chart 2)

Crude oil prices are below both the rising trendline from the December 2021, April 2022, and May 2022 lows and the symmetrical triangle in place since the end of February. The rebound from the support zone between 90.06 and 94.42 can’t be dismissed, however. Crude oil prices are back above their daily 5- and 8-EMAs, but below their daily 13- and 21-EMAs; the EMA envelope remains in bearish sequential order. Daily MACD is close to issuing a bullish crossover but remains deep below its signal line, and daily Slow Stochastics have yet to return above their median line. As noted last week, “momentum is starting to turn the corner, but not enough to suggest that a workable low has been established.” A move above the daily 21-EMA would coincide with a return into the symmetrical triangle, which would offer the greatest confidence that the sell-off has finished.
Crude Oil Price Technical Analysis: Weekly Chart (March 2008 to July 2022) (Chart 3)
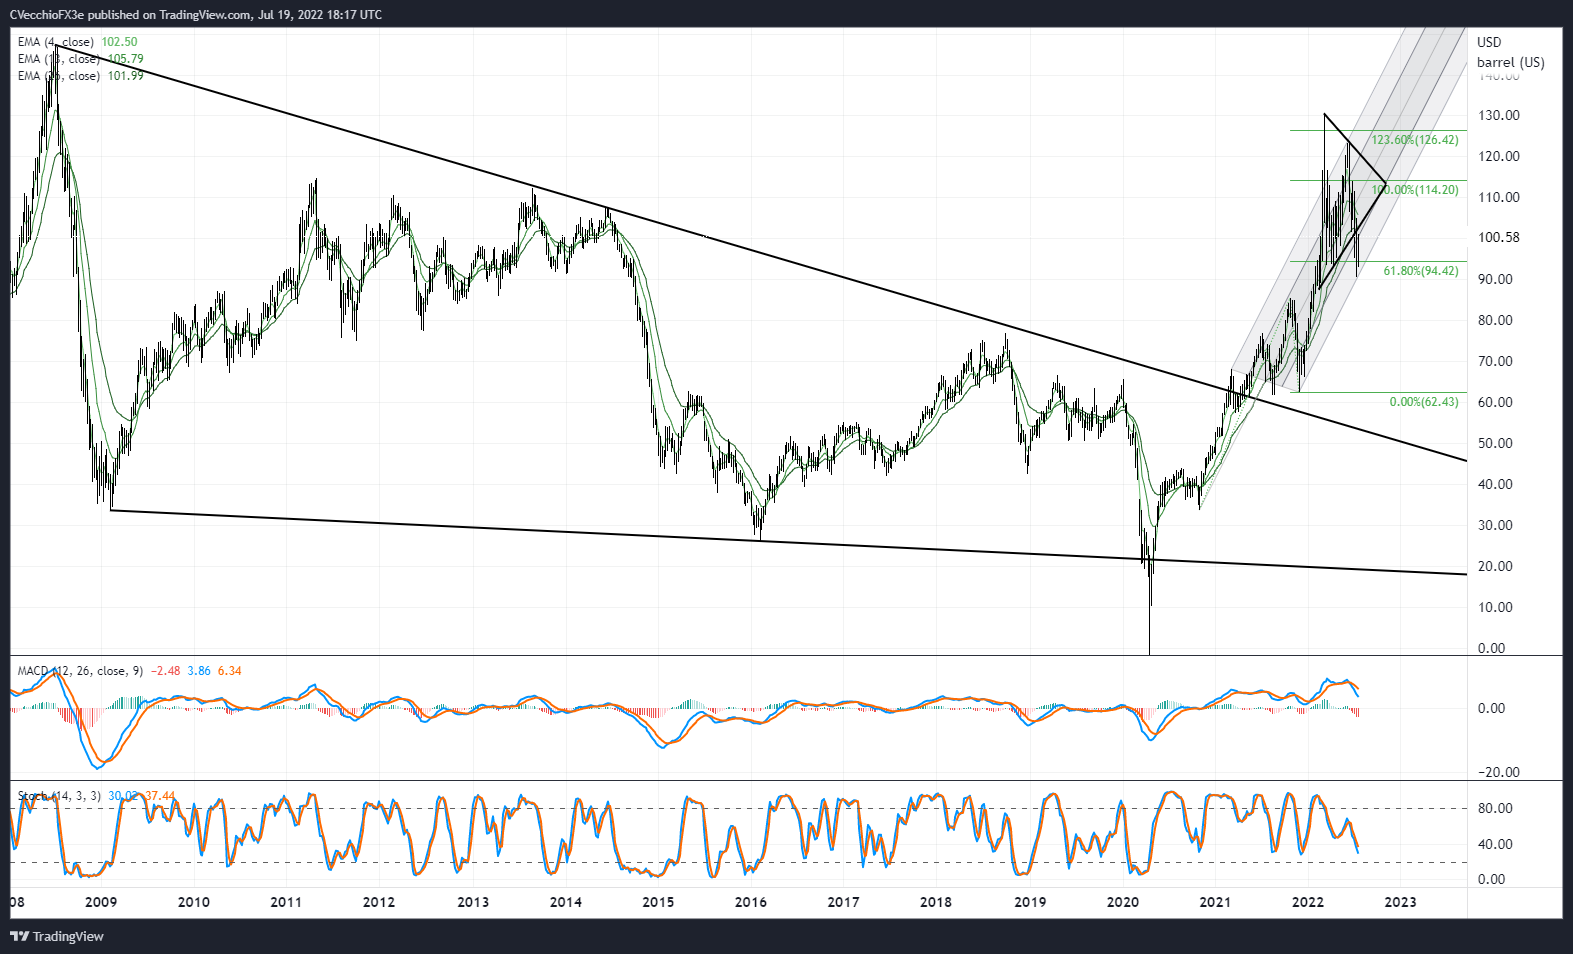
Momentum continues to give a mixed if not more bearish perspective on the weekly timeframe. Crude oil prices are below their weekly 4-, 8-, and 13-EMAs, but the weekly EMA envelope is in neither bearish nor bullish sequential order. Weekly MACD continues to decline but remains above its signal line, and weekly Slow Stochastics have just dropped below their median line. If the rebound from support gathers pace, the weekly timeframe may not reflect such a development”

IG CLIENT SENTIMENT INDEX: CRUDE OIL PRICE FORECAST (July 19, 2022) (CHART 4)
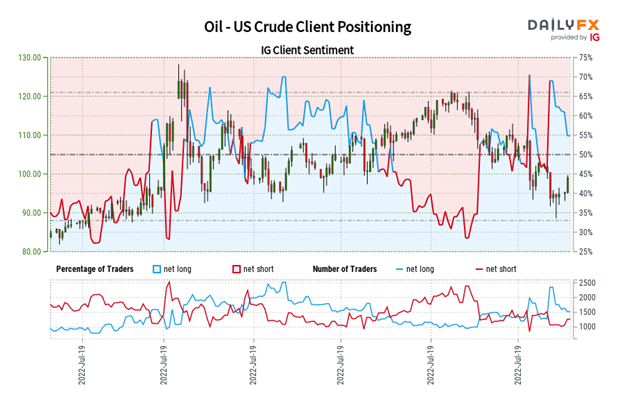
Oil - US Crude: Retail trader data shows 56.84% of traders are net-long with the ratio of traders long to short at 1.32 to 1. The number of traders net-long is 4.92% lower than yesterday and 5.54% lower from last week, while the number of traders net-short is 2.53% higher than yesterday and 11.55% lower from last week.
We typically take a contrarian view to crowd sentiment, and the fact traders are net-long suggests Oil - US Crude prices may continue to fall.
Positioning is less net-long than yesterday but more net-long from last week. The combination of current sentiment and recent changes gives us a further mixed Oil - US Crude trading bias.
Trade Smarter - Sign up for the DailyFX Newsletter
Receive timely and compelling market commentary from the DailyFX team
--- Written by Christopher Vecchio, CFA, Senior Strategist


