


Crude Oil Technical Analysis Talking Points:
- The fundamental backdrop behind crude oil was looked at earlier this morning by DailyFX Analyst, Dani Hathorn.
- I had looked into the longer-term technical backdrop behind crude oil prices earlier this week, this article will be a shorter-term update to that analysis.
- The analysis contained in article relies on price action and chart formations. To learn more about price action or chart patterns, check out our DailyFX Education section.
Crude oil prices remain range-bound on a short-term basis, and there’s been little excitement over the past couple of days. There is, however, a possible strain of deduction that may be opening the door for a more decisive move. But first, the range that was looked at on Tuesday is shown below with updated price action since that last article was published.
Crude Oil (CL2) Two Hour Price Chart

Chart prepared by James Stanley; CL2 on Tradingview
Bound to Break One Way or the Other
Crude oil prices were in aggressive trends coming into late March, at which point price action built into the range. And yesterday saw a resistance inflection come in off of the psychological 60-handle, a big level on the wti chart.
But there’s also been a series of lower-highs, and when meshed with horizontal support, that forms the basis for a descending triangle formation – which will often be approached with the aim of bearish breaks.
To learn more about the descending triangle pattern, join us in DailyFX Education
This sets up for a fairly big test at that 60 level, which is currently confluent with the short-term trendline taken off of this week’s swing-highs.
Crude Oil (CL2) Four-Hour Price Chart
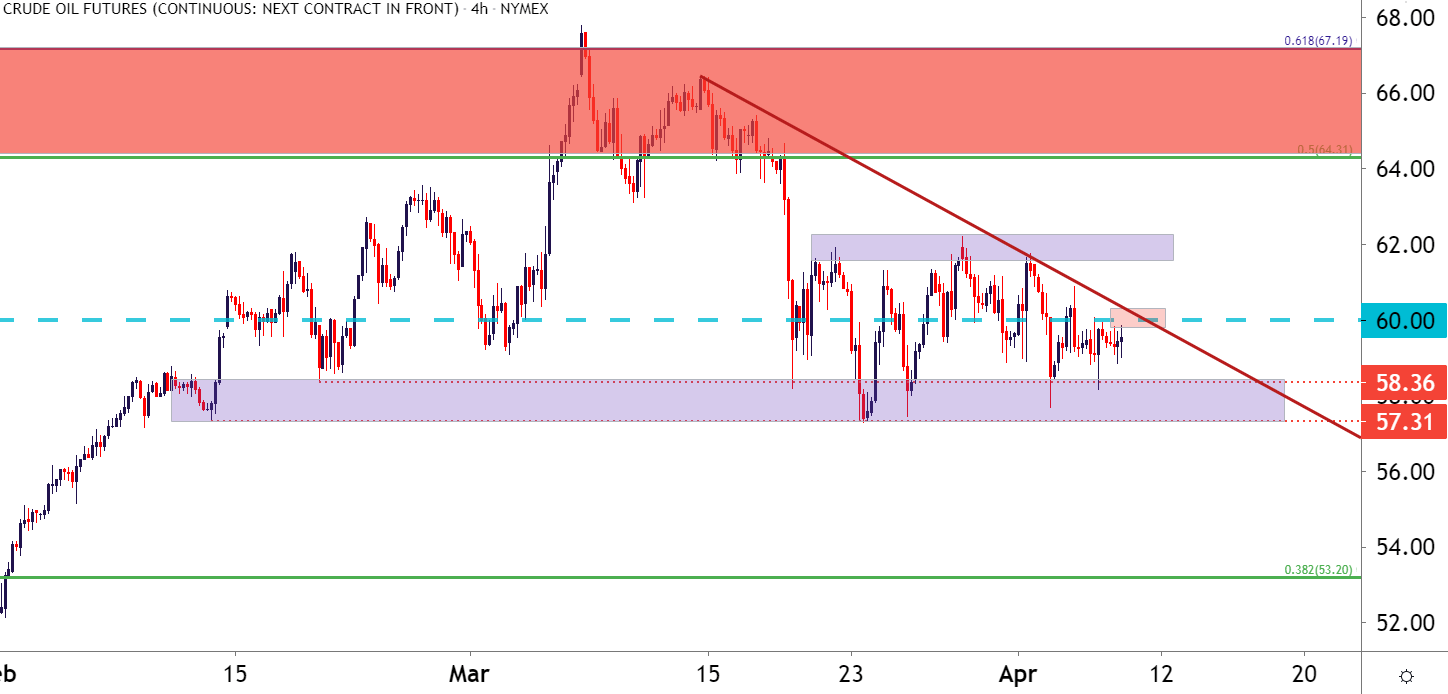
Chart prepared by James Stanley; CL2 on Tradingview
--- Written by James Stanley, Strategist for DailyFX.com
Contact and follow James on Twitter: @JStanleyFX


