


Crude Oil Talking Points:
- A riveting run in oil after the Presidential Election has finally found some element of resistance.
- Prices have been range-bound for the past couple of weeks, but the preceding bullish trend was extremely consistent. Are buyers taking a break or is this prelude to a deeper reversal?
- The analysis contained in article relies on price action and chart formations. To learn more about price action or chart patterns, check out our DailyFX Education section.
To say that oil prices have been choppy of late would be an understatement. But, with a bit of perspective, that choppiness can take on form…
Perhaps more surprising is from where this lack of direction comes from, as oil prices launched higher after the Presidential Election and didn’t really stop or slow down until mid-March. Of course, there was some political drive in there but the technical backdrop has been equally supportive as a bullish trend continued to run until a significant area of resistance came into play early last month around the $67 handle on the chart. Since then, the music has stopped, or at least slowed into a grinding backdrop within an approximate $4 range.
Crude Oil (CL2) Two Hour Price Chart

Chart prepared by James Stanley; CL2 on Tradingview
Taking a step back to the daily chart can help to put this recent grind into scope. Much of the below chart is the same as I had published two weeks ago. At the time, I was looking at a significant zone of confluent resistance that had come into play, marked by a couple of different Fibonacci levels. That resistance has held and prices have pulled back.
But from the below chart, you’ll probably also notice a trendline projection that’s coming into play to help set support for the past few weekly bars. This will be touched on a bit deeper.
To learn more about trendlines and how to draw and work with them, check out DailyFX Education
Crude Oil (CL2) Weekly Price Chart

Chart prepared by James Stanley; CL2 on Tradingview
Crude Oil Strategy Near-Term
To recap, we have a longer-term bullish trend in oil that’s currently beset by a near-term range, following a resistance test at a really big spot on the long-term chart.
So, at this point, the trader’s options are fairly clear: Either trade the range or wait for a break. There is, however, the possibility of threading short and long-terms, by approaching that near-term range with a topside bias, looking for the longer-term trend to push up for another re-test of the resistance zone running from 64.31-67.19.
An approach of this nature can be nudged in a variety of directions. For those with ultra short-term views, range support in the 57.31-58.33 area could allow for bullish scenarios, looking for first a test of range resistance followed by an extension of the bullish move. Alternatively and for those with a slightly longer-term horizon, awaiting a solid hold of support at the 60 psychological level may be more fitting. As noted on the prior weekly chart, those underside wicks over the past few weeks, around the trendline projection but also confluent with the 60 psych have helped to keep the longer-term look as bullish. That can be incorporated in a slightly shorter-term horizon by watching for the key event of a 60 support hold.
Crude Oil (CL2) Daily Price Chart
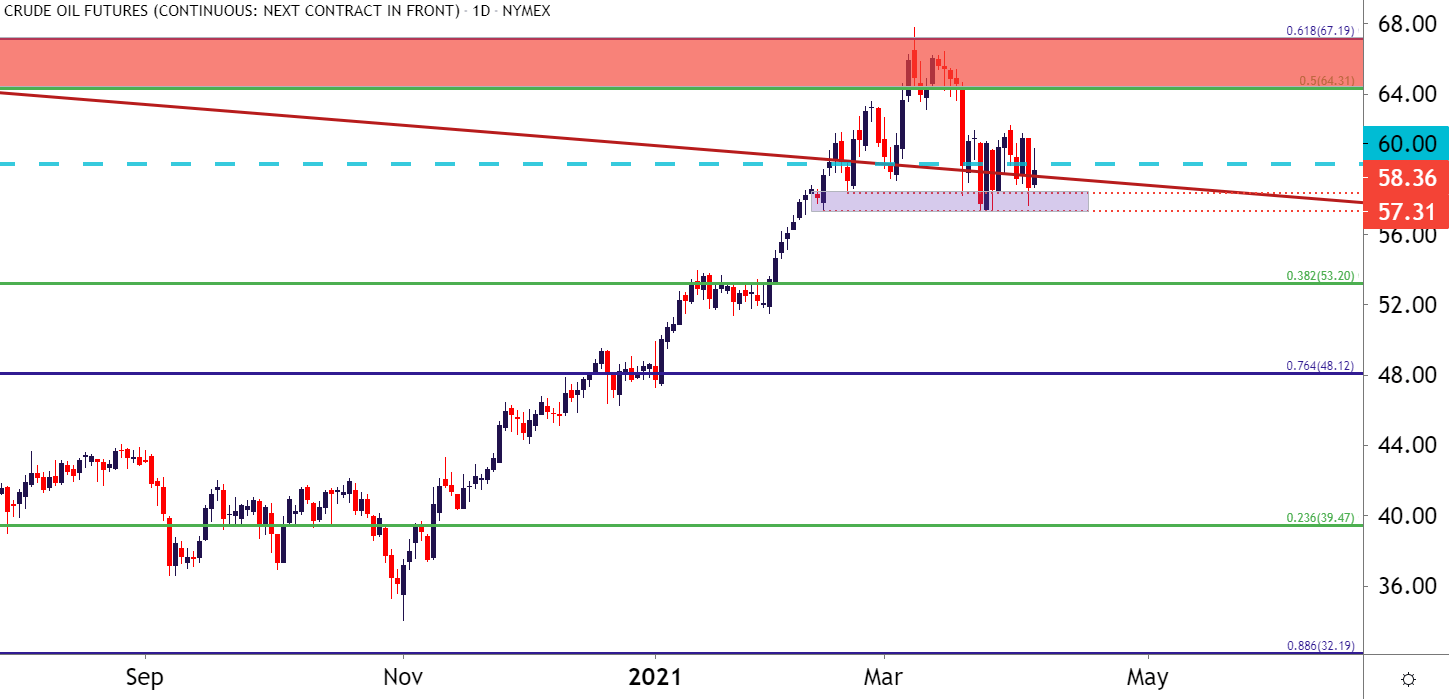
Chart prepared by James Stanley; CL2 on Tradingview
--- Written by James Stanley, Strategist for DailyFX.com
Contact and follow James on Twitter: @JStanleyFX


