OIL FORECAST: CRUDE OIL TESTS TECHNICAL SUPPORT AFTER SINKING NEARLY 20% INTO BEAR MARKET TERRITORY
- Crude oil has plunged a boggling 17% from its year-to-date high in response to a confluence of bearish fundamental developments
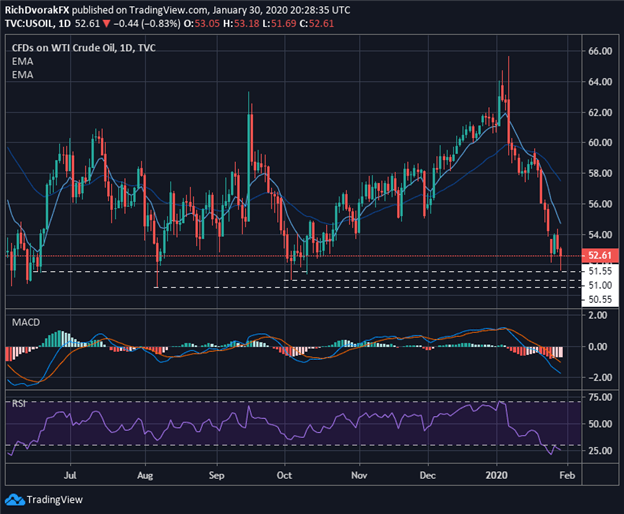
- A modicum of technical support residing below crude oil prices has potential to prevent the commodity from sliding into a bear market
- The return of volatility has weighed negatively on crude oil price action, but the selloff may soon prove to be overdone as coronavirus fears fade
Crude oil is down well over 10% so far this year and has cratered a staggering 17% from its closing price of $63.27printed on January 06.
The free-fall in crude oil prices has pushed the commodity to the edge of sinking into a bear market after a series of fundamental catalysts – like cooling Middle East tensions and growing coronavirus outbreak fears – prompted a major selloff.
CRUDE OIL CHART: DAILY TIME FRAME (JUNE 2019 TO JANUARY 2020)

Chart created by @RichDvorakFX with TradingView
Owing to the widespread impact on consumer spending and ultimately global GDP growth due to recent coronavirus-related travel restrictions, worries of a healthcare epidemic in China and abroad has stunted expected demand for crude oil.


Yet the latest update from the World Health Organization (WHO) did not recommend any restrictions on trade or travel at this time and how the group continues to have confidence in China’s capacity to control the outbreak of the novel coronavirus.
On that note, crude oil may be at the onset of a broader reversal higher while several technical barriers residing slightly below current crude oil prices also have potential to send the commodity rebounding.
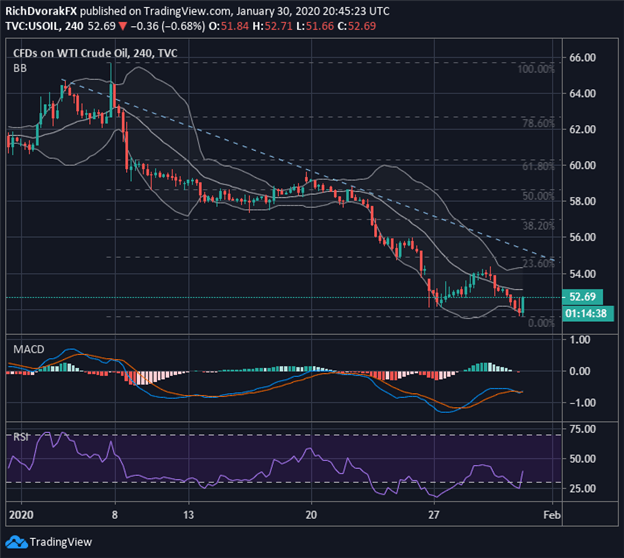
CRUDE OIL CHART: 4-HOUR TIME FRAME (JANUARY 2020)

Chart created by @RichDvorakFX with TradingView
Looking at a crude oil chart with a closer time frame reflects the slow-and-steady grind lower etched out by spot prices over the last several trading days.
A major reversal to the upside could be brewing, however, as the RSI and MACD indicators on a crude oil chart using 4-hour candlesticks both suggest the commodity is notching positive divergence.


That said, the price of crude oil might rebound back toward the $54.00 to $55.00 zone – underpinned roughly by the January 24 close, January 29 high and 23.6% Fibonacci retracement of oil’s year-to-date trading range – a before finding technical resistance.
-- Written by Rich Dvorak, Junior Analyst for DailyFX.com
Connect with @RichDvorakFX on Twitter for real-time market insight


