


Japanese Yen, AUD/JPY, NZD/JPY, USD/JPY, IGCS – Talking Points:
- AUD/JPY eyeing fresh yearly highs after breaching range resistance.
- USD/JPY consolidating below 200-MA.
- An ascending Schiff Pitchfork may continue to guide NZD/JPY higher.
The Japanese Yen is at risk of extending recent losses against its major counterparts, as rising inflation expectations, the prospect of additional fiscal stimulus and positive vaccine progress weighs on the haven-associated currency. Here are the key levels to watch for AUD/JPY, NZD/JPY and USD/JPY in the week ahead.
AUD/JPY Daily Chart – Range Breach Hints at Further Upside
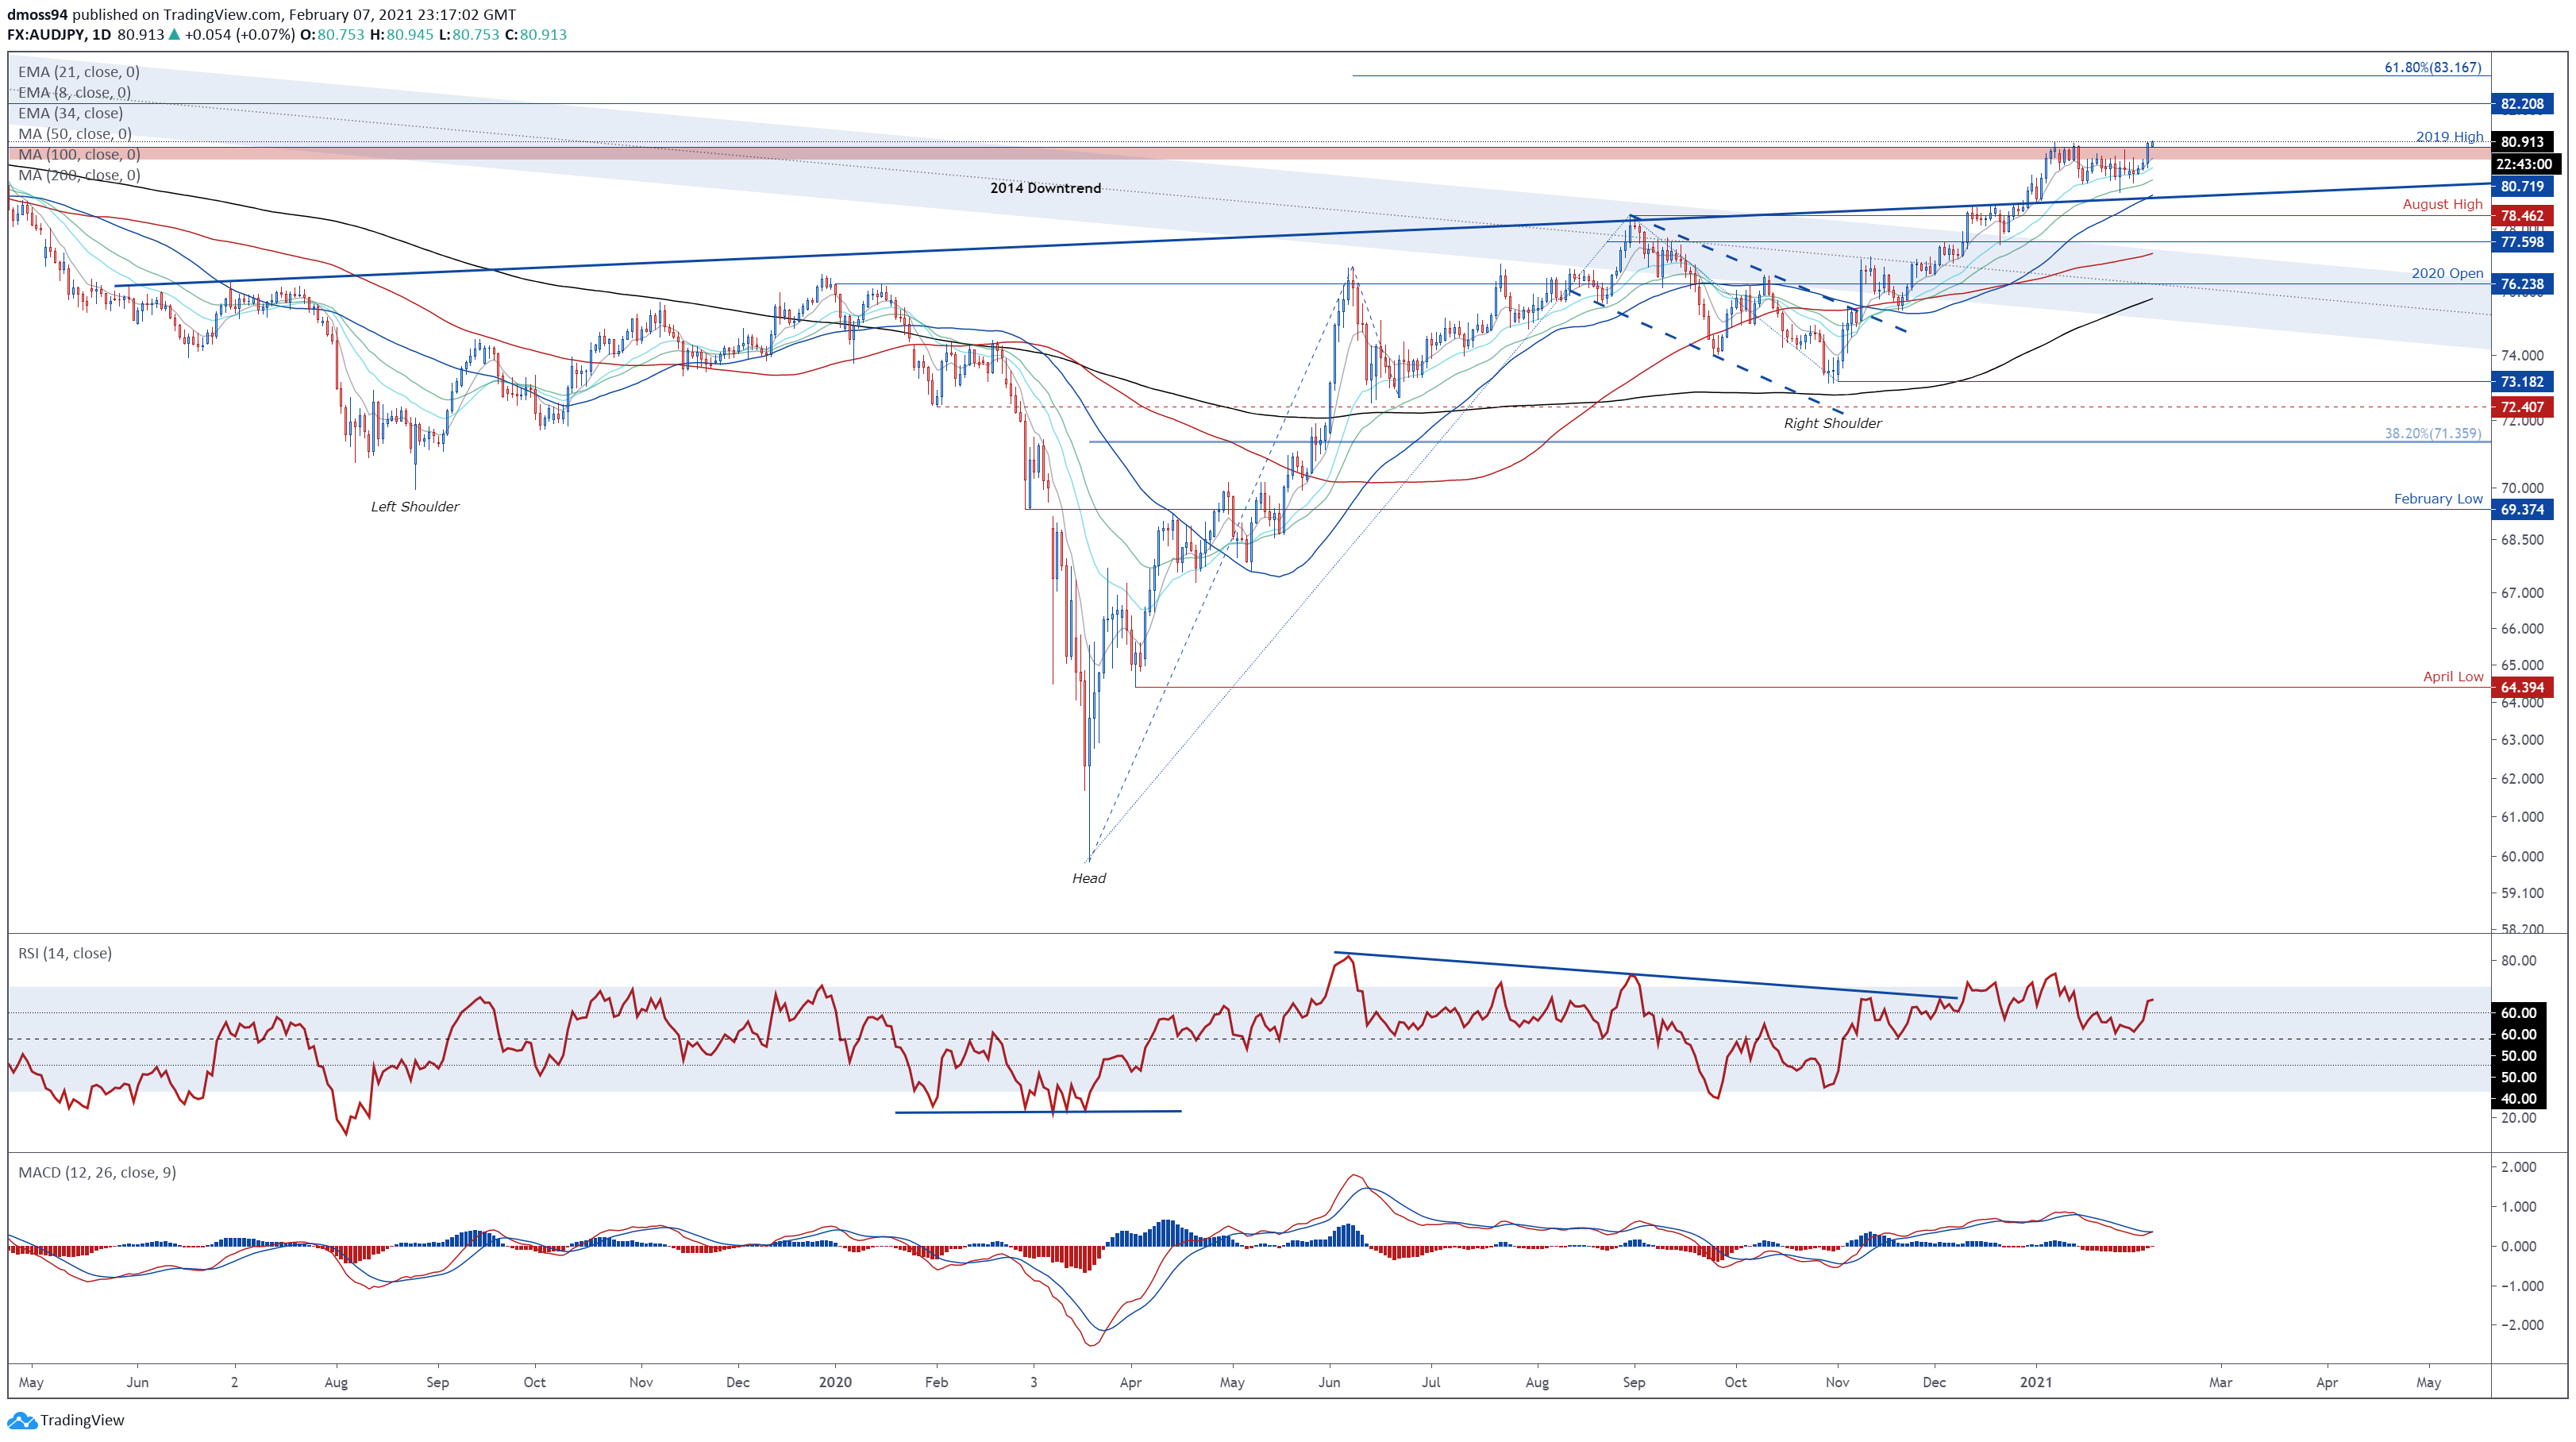
AUD/JPY daily chart created using Tradingview
AUD/JPY looks set to extend its recent push to yearly highs, as price surges convincingly above the 2019 high (80.72) and continues to track firmly above all 6 moving averages.
The RSI pushing above 60 and a bullish crossover taking place on the MACD indicator hints at swelling bullish momentum.
A daily close above the psychologically imposing 81.00 mark would probably propel price towards resistance at 82.20. Breaching that brings the 61.8% Fibonacci (83.17) into the crosshairs.
The inverse Head and Shoulders pattern’s implied measured move suggesting the exchange rate could climb an additional 15% to challenge the 93.00 level.
However, if 81.00 successfully neutralizes selling pressure, a pullback towards the monthly low (79.54) could be on the cards.
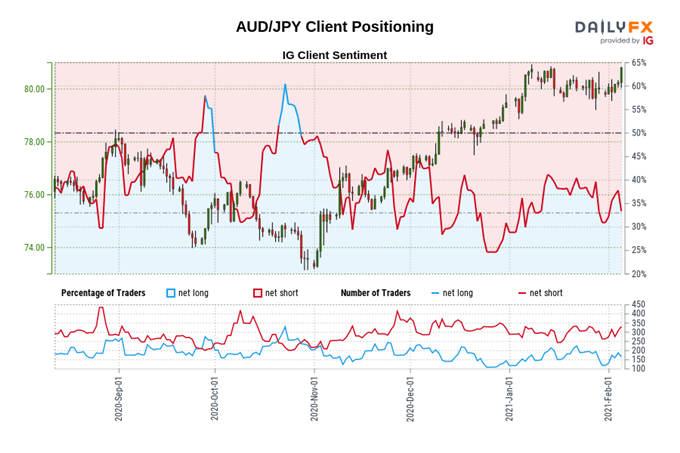
The IG Client Sentiment Report shows 25.27% of traders are net-long with the ratio of traders short to long at 2.96 to 1. The number of traders net-long is 27.88% lower than yesterday and 1.71% higher from last week, while the number of traders net-short is 6.67% higher than yesterday and 34.35% higher from last week.
We typically take a contrarian view to crowd sentiment, and the fact traders are net-short suggests AUD/JPY prices may continue to rise.
Traders are further net-short than yesterday and last week, and the combination of current sentiment and recent changes gives us a stronger AUD/JPY-bullish contrarian trading bias.
USD/JPY Daily Chart – Consolidating Below 200-MA
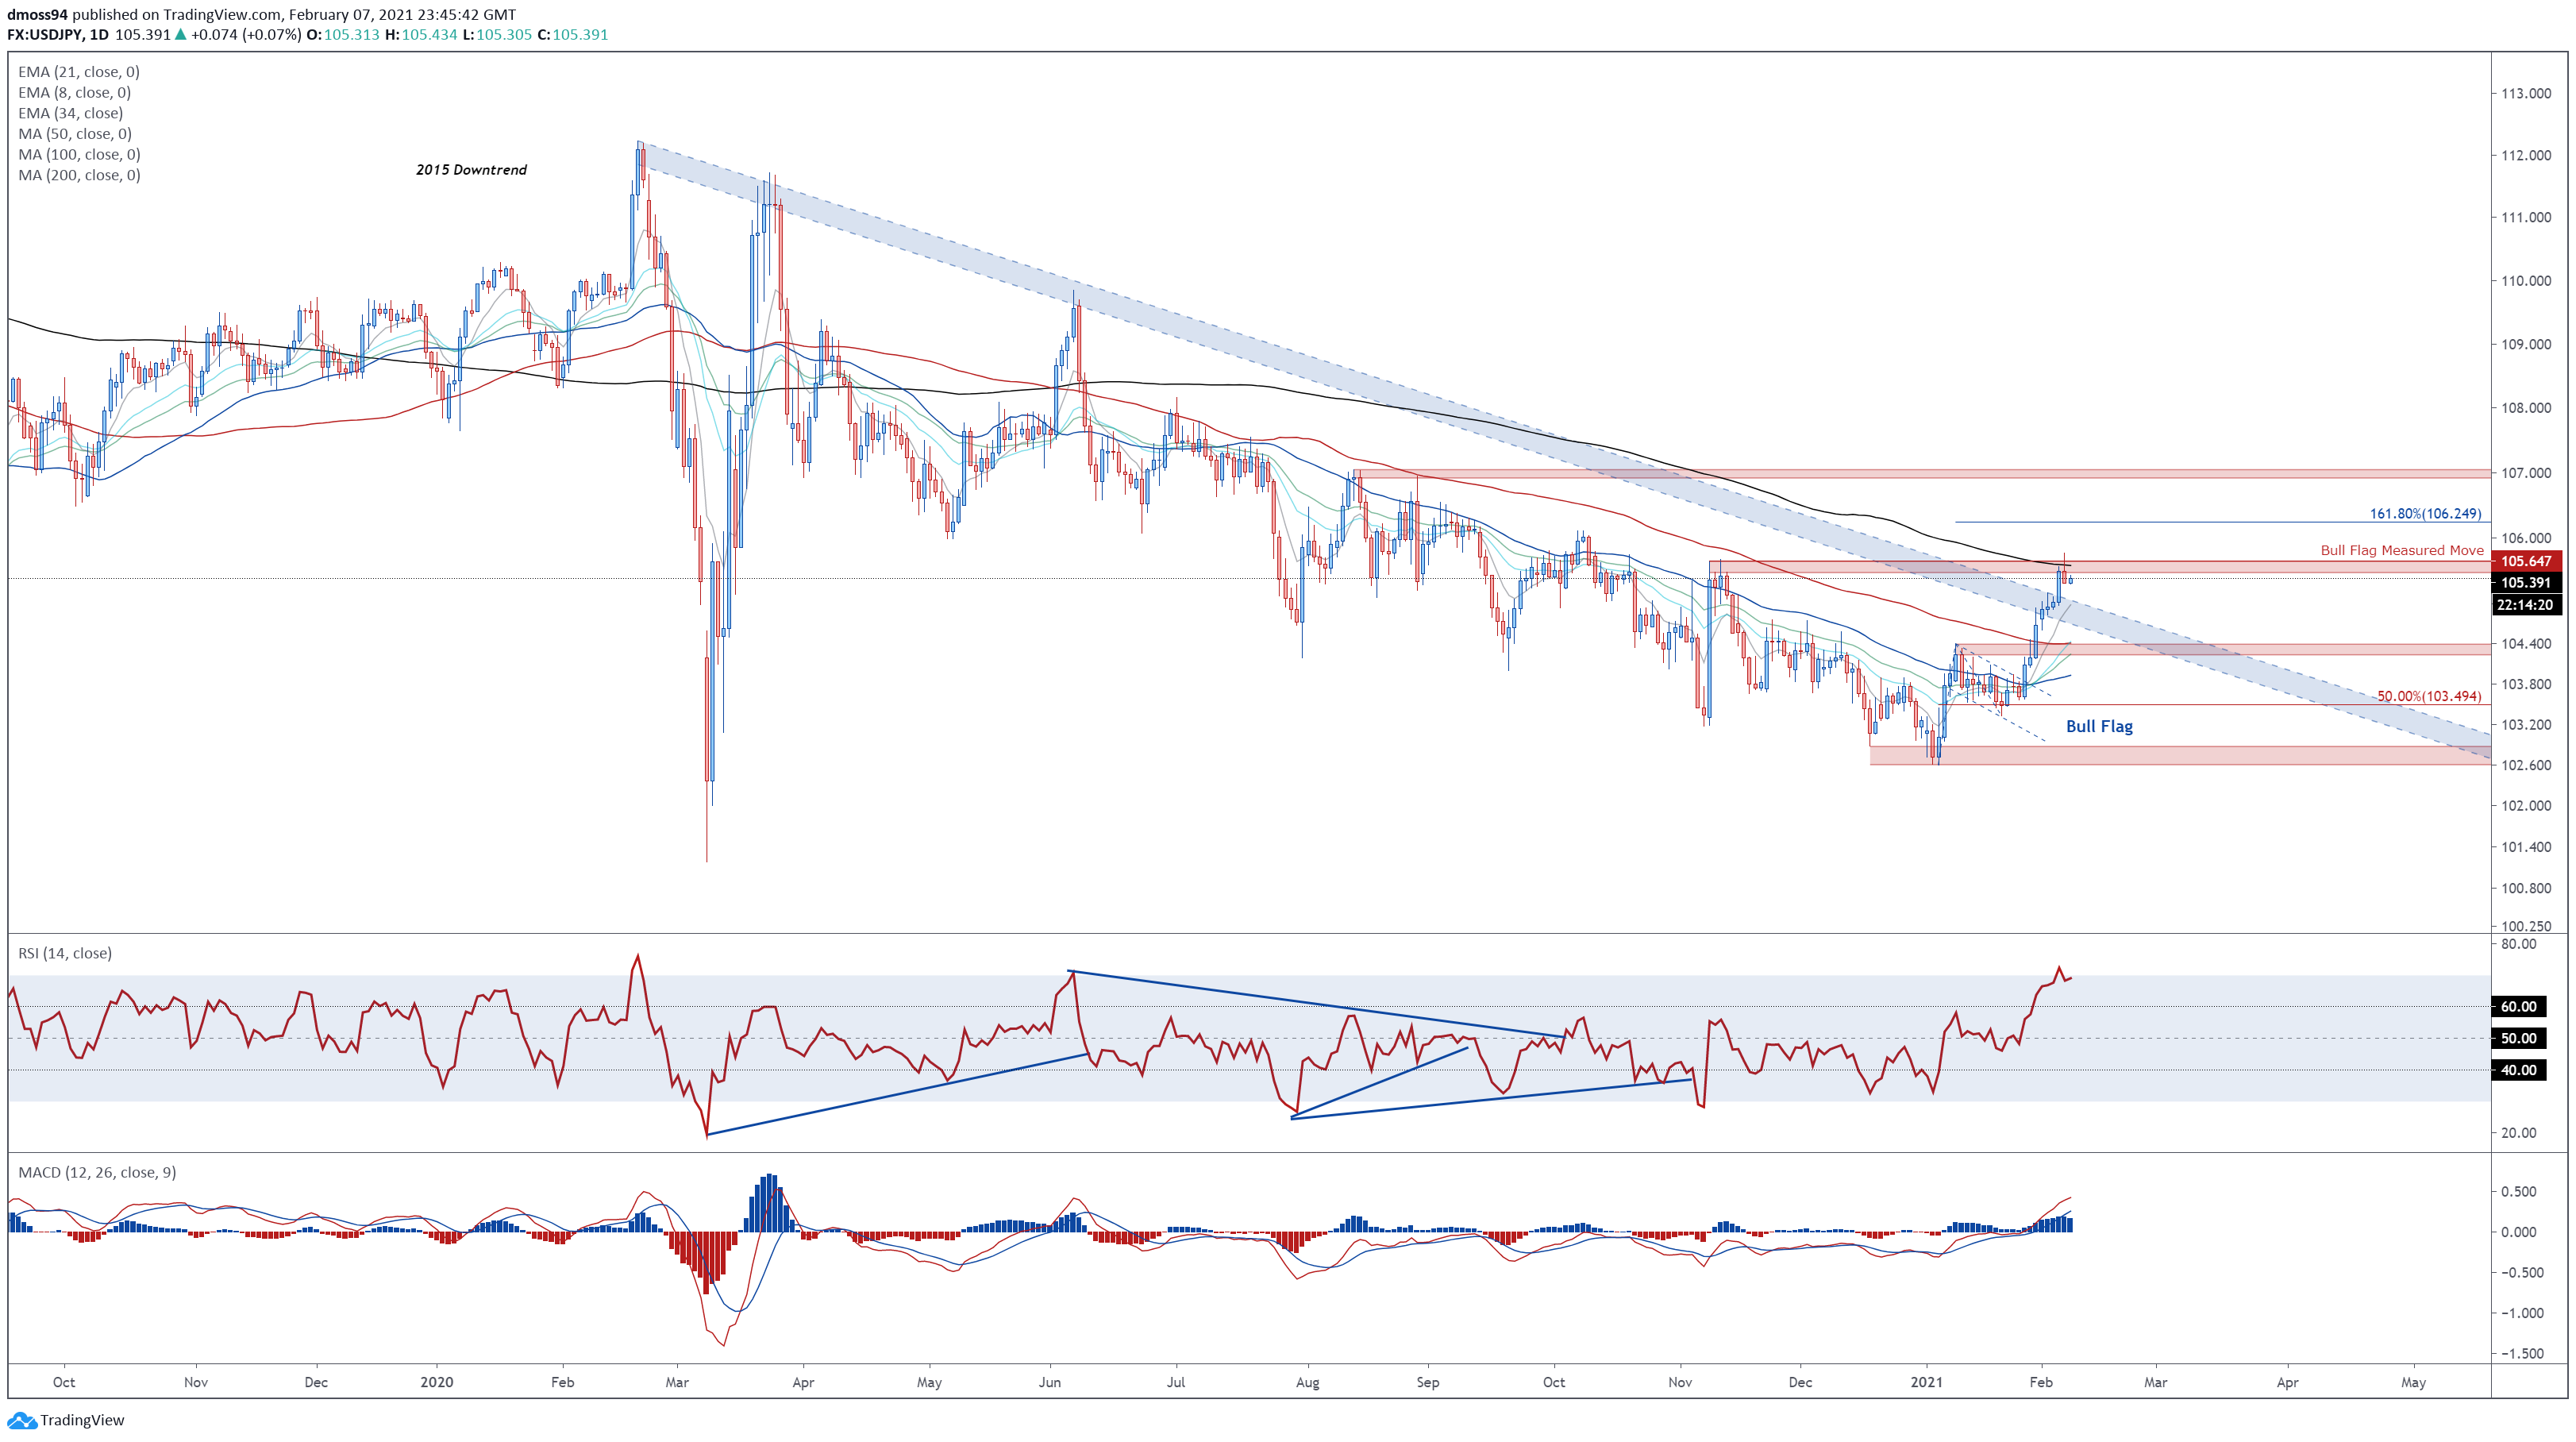
USD/JPY daily chart created using Tradingview
As expected, USD/JPY extended its impulsive surge above psychological resistance at 105.00 to challenge range resistance at 105.50 – 105.65 and fulfil the Bull Flag continuation pattern’s implied measured move.
Further gains seem likely in the near term, as the RSI storms into overbought territory for the first time since June 2020, and the MACD indicator climbs to its highest levels in over 9 months.
Gaining a firm foothold above the sentiment-defining 200-MA (105.60) would probably signal the resumption of the primary uptrend and carve a path for price to challenge the 161.8% Fibonacci expansion (10625).
Hurdling that paves the way for the exchange rate to begin probing the resistance range at 106.95 – 107.05.
Alternatively, a short-term pullback towards the 8-EMA (104.99) could eventuate if buyers are unable to hurdle the 200-MA.
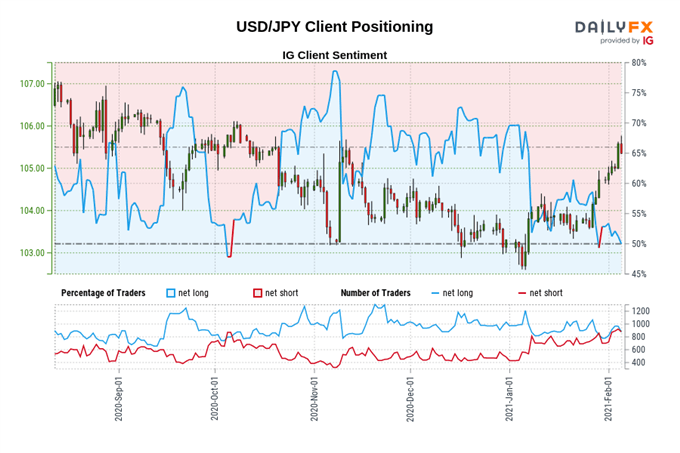
The IG Client Sentiment Report shows 47.96% of traders are net-long with the ratio of traders short to long at 1.09 to 1. The number of traders net-long is 12.00% lower than yesterday and 1.55% lower from last week, while the number of traders net-short is 5.15% lower than yesterday and 19.48% higher from last week.
We typically take a contrarian view to crowd sentiment, and the fact traders are net-short suggests USD/JPY prices may continue to rise.
Traders are further net-short than yesterday and last week, and the combination of current sentiment and recent changes gives us a stronger USD/JPY-bullish contrarian trading bias.
NZD/JPY Daily Chart – Schiff Pitchfork Guiding Price Higher
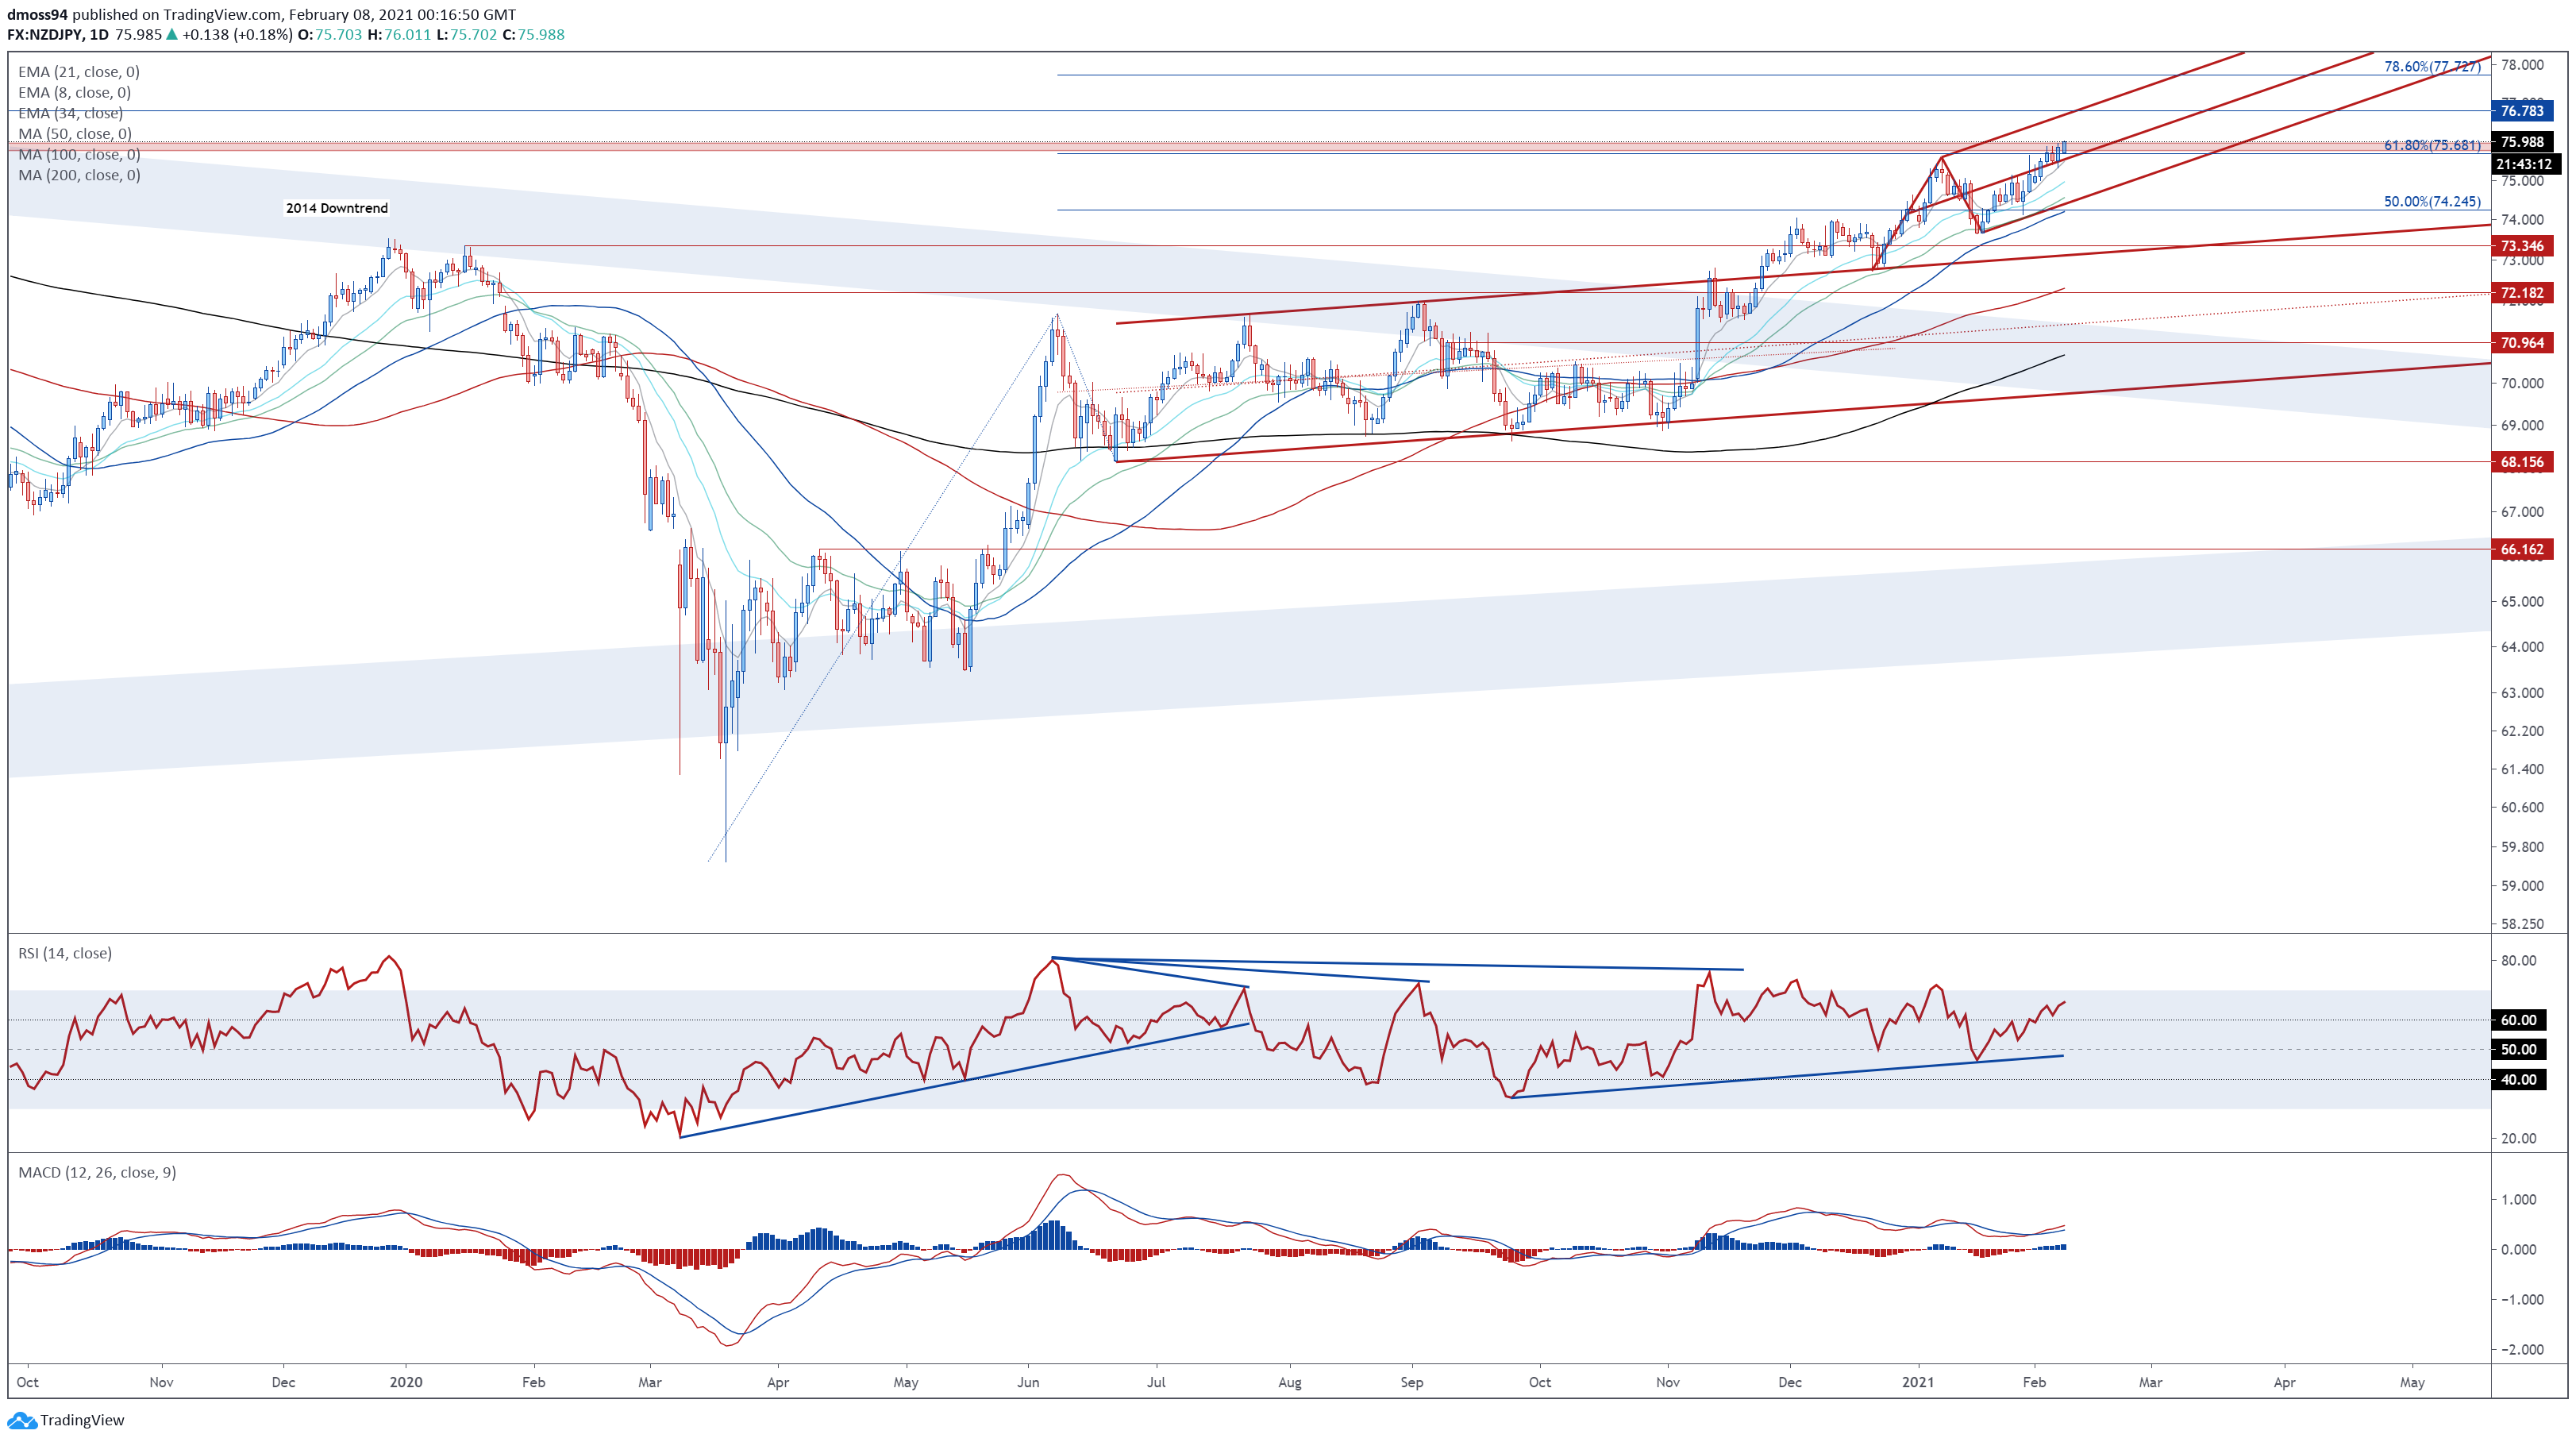
NZD/JPY daily chart created using Tradingview
The technical outlook for NZD/JPY continues to hint at further gains, as the exchange rate surges above the 76.00 mark for the first time since April 2019.
With the RSI continuing to travel above 60, and the MACD indicator aiming higher, the path of least resistance seems skewed to the topside.
A daily close above 76.00 is required to signal further upside and open the door for buyer to test confluent resistance at the pitchfork parallel and 2019 high (76.78).
However, slipping back below the 61.8% Fibonacci (75.68) could neutralize near-term selling pressure and generate a throwback towards the 34-EMA (74.56).
-- Written by Daniel Moss, Analyst for DailyFX
Follow me on Twitter @DanielGMoss


