


Japanese Yen, US Dollar, USD/JPY, Treasury Yields, Inflation – Talking Points:
- Rising Treasury yields may open the door for the US Dollar to continue outperforming the Japanese Yen.
- US 10-Year Treasury yields eyeing a push to retest yearly highs.
- USD/JPY may extend recent gains after validating the topside break of a Bull Flag continuation pattern.
Rising Yields to Weigh on JPY
The Japanese Yen has lost a significant amount of ground against the US Dollar in recent weeks, after climbing to its strongest levels against the Greenback in 10 months at the start of 2021. This marked weakening seems to be driven by the notable turn higher in US Treasury yields, which have been buoyed by rising inflation expectations, the prospect of additional fiscal stimulus and positive vaccine progress.
The US has currently administered over 31.1 million vaccination doses, while the 7-day moving average tracking local coronavirus infections has decreased by over 100,000 since peaking at 255,00 on January 11. These encouraging developments could drive yields even higher, as market participants begin to bet on a return to some form of normality in the coming months.
US 10-Year Yields vs USD/JPY

USD/JPY vs US 10Y Yields daily chart created using Tradingview
Moreover, there is a growing notion that inflation is climbing in the US, with the ISM Manufacturing Prices index soaring to a 42 year high in January and the annual inflation rate rising to 1.4% (est. 1.3%) in December. Additionally, with Democrats clearing the way to pass much of President Biden’s proposed $1.9 trillion stimulus package through the budget reconciliation process, further downward pressure on bond prices looks likely in the near term.
Therefore, it appears the Japanese Yen could extend recent losses against the US Dollar, as the current fundamental backdrop suggests that yields may continue to rise.
US 10-Year Yields Daily Chart – Ascending Channel Guiding Rates Higher

US 10Y yields daily chart created using Tradingview
From a technical perspective, the path of least resistance for US 10-year Treasury yields seems higher, as rates continue to track within the confines of an Ascending Channel and above all three moving averages – 50-, 100- and 200-day.
Pushing above 1.10 could see yields retest the yearly high set on January 12 (1.18). Breaching that probably ignites an impulsive topside push to challenge the March 2020 high (1.28) and would likely coincide with further gains for the USD/JPY exchange rate.
Alternatively, a pullback towards the November high (0.98) could be on the cards if psychological resistance at 1.10 holds firm. This may open the door for the Japanese Yen to recover against the Greenback in the short term.
USD/JPY Daily Chart – Eyeing 200-MA After Breaching Bull Flag Resistance
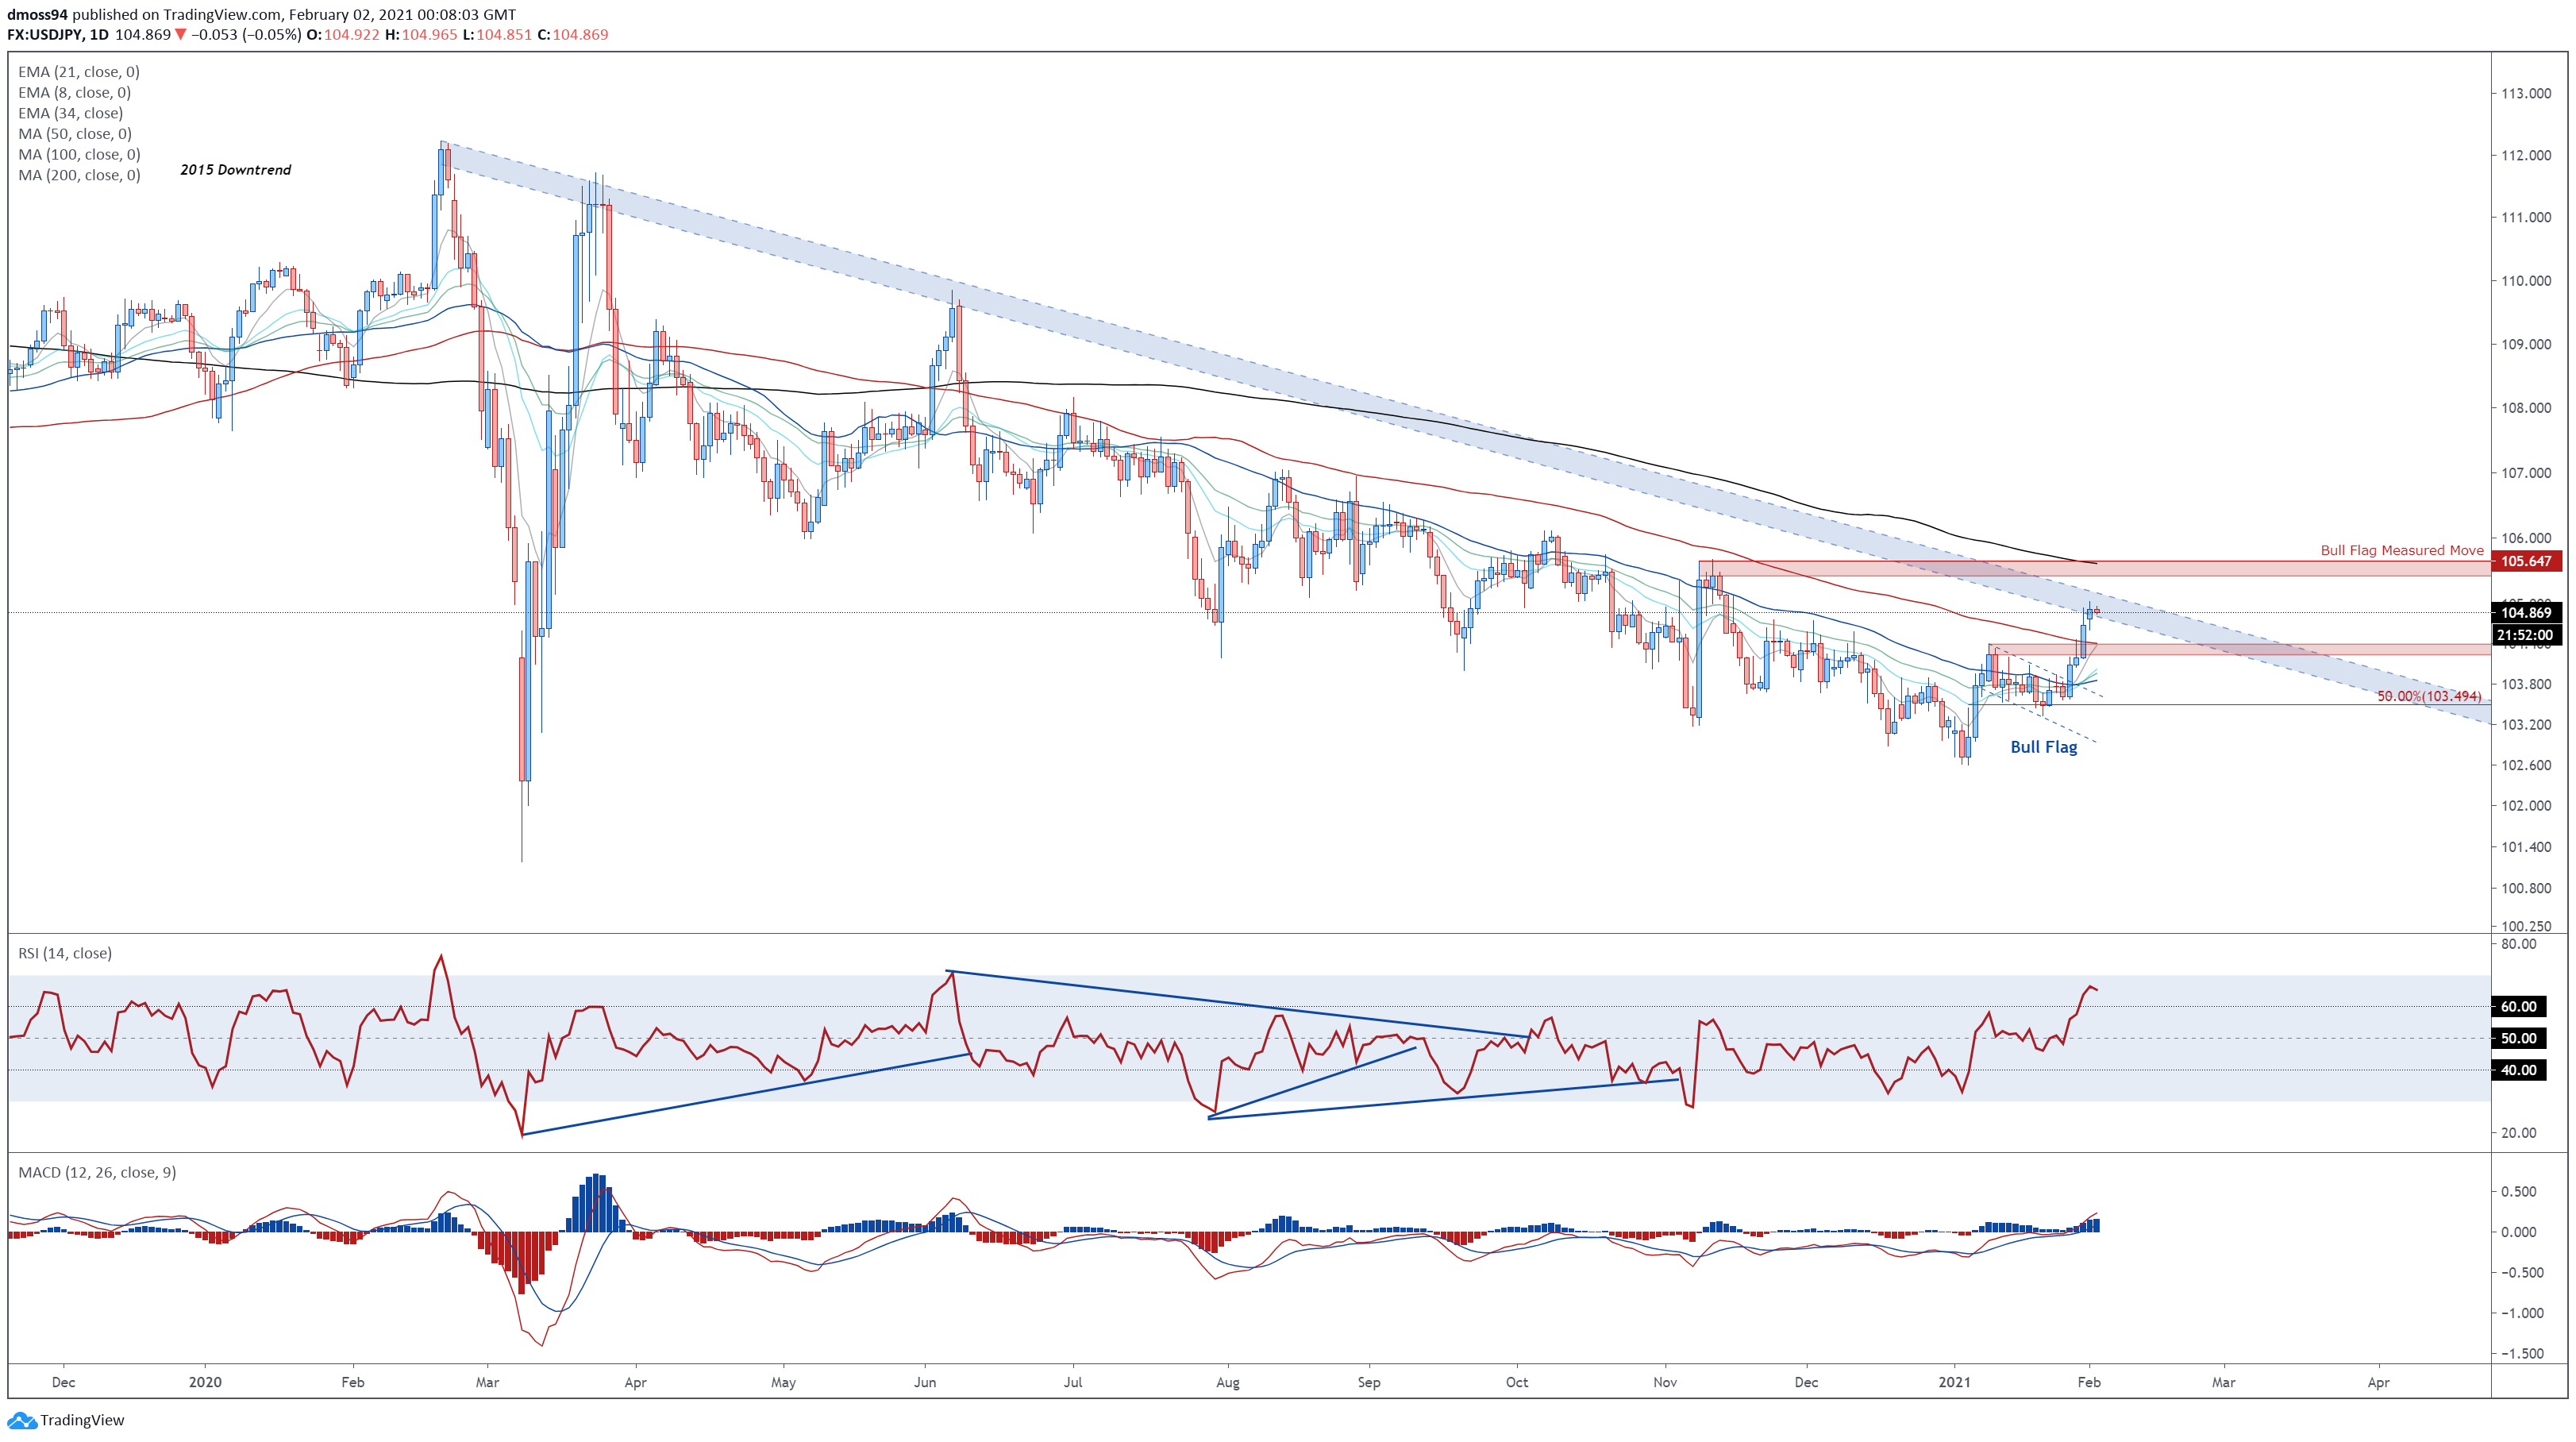
USD/JPY daily chart created using Tradingview
USD/JPY appears poised to extend its recent surge to fresh yearly highs, after validating the topside break of a Bull Flag continuation pattern and surging through range resistance at 104.25 – 104.40.
With the RSI climbing to its highest levels since June, and the MACD pushing into positive territory for the first time since June, the path of least resistance seems skewed to the topside.
A daily close above psychological resistance at 105.00 is probably required to penetrate the downtrend extending from the February 2020 high and carve a path for prices to fulfil the Bull Flag’s implied measured move (105.65).
However, if 105.00 remains intact, a short-term pullback towards former support-turned-resistance at 104.40 could be in the offing.
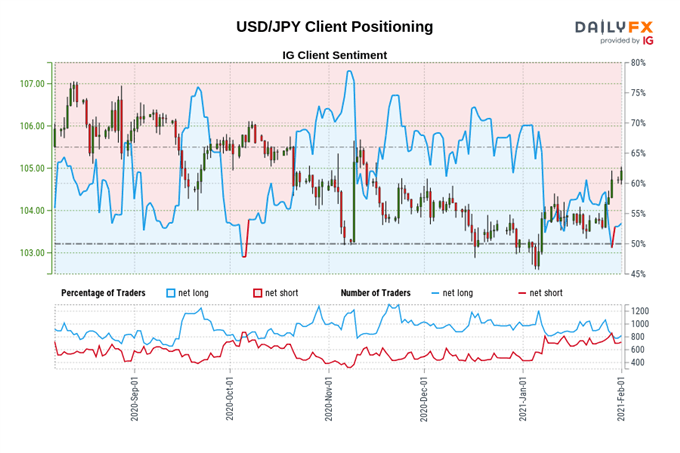
The IG Client Sentiment Report shows 53.04% of traders are net-long with the ratio of traders long to short at 1.13 to 1. The number of traders net-long is 19.48% higher than yesterday and 6.84% lower from last week, while the number of traders net-short is 18.33% higher than yesterday and 19.01% higher from last week.
We typically take a contrarian view to crowd sentiment, and the fact traders are net-long suggests USD/JPY prices may continue to fall.
Positioning is more net-long than yesterday but less net-long from last week. The combination of current sentiment and recent changes gives us a further mixed USD/JPY trading bias.
-- Written by Daniel Moss, Analyst for DailyFX
Follow me on Twitter @DanielGMoss


