


USD/JPY Rate Forecast Talking Points:
- USD/JPY Price Forecast: JPY strength likely as market considers potential BoJ tapering
- Will USD/JPY Break its Trading Range?
- USD/JPY Rate Insight from IG UK: sharp rise in retail long positions favors downside
Traders around the world on Tuesday woke up to a surprise BoJ development that may seem small on absolute terms, but could lead to a broader shift in their Quantitative & Qualitative Easing Program (QQE.)
The Japanese Yen, which has been the last currency whose central bank in the G4 is limiting discussions on when they will remove their easing program to support the economy notified markets that they were reducing their purchases of super-long bonds, which caused rate prices to drop and yields to jump. This may be a far cry from a taper announcement, but given that the bond bull market has been supported by fewer central bank buyers, another central bank pulling back could be cause for natural concern.
JPY Strengthens Across the Board on Surprise BoJ Announcement
The Bank of Japan’s surprise statement that they will not buy as many long-end bonds as they had been caused investors to be cautious on US notes too. The action sent the US 10Yr note (IG CFD: US 10-Year T-Note) yield to a nine-month high at 2.53% as the inversely related price fell to a nine-month low.
A subsequent move higher to beyond 2.63% would be the highest US10Yr note yield since 2014. Such a move has historically led to a higher USD/JPY, but the Bank of Japan Announcement seems to hold the focus of JPY traders. This week, markets have also seen the US Bond Markets inflation gauge reach 10-month highs that could additionally scare bond buyers.
Correlated Markets Losing Sway With USD/JPY
While the USD/JPY rate has traded sideways for much of the last trading year, the price seems to be dislocating from a lot of correlated markets. Over the last year, the Japan Nikkei (IG CFD: JAPAN225) is up 23%, and the price of Gold (IG CFD: Gold) is up nearly 16%. Meanwhile, USD/JPY is down less than 5%.
The rise in JPY (drop in USD/JPY) aligns with the rise in Gold. However, the rise in the Nikkei typically leads to a jump in USD/JPY, but that has not been playing out recently. The inability for USD/JPY to rise as correlated markets like the Nikkei suggest it should mean that pressure could remain on further upside making the downside more the more probable.
Unlock our Q1 forecast to learn what will drive trends for the Japanese Yen and the US Dollar at the start of 2018!
Traders looking to the charts can short-cut the analysis by keeping a focus on the main support and resistance points. Resistance can be found at 113.40. A break and close above 113.40 with the correlated backdrop would favor further upside to 114.73, the high traded up to in early November.
Key support can be found at 112. A breakdown and close below 112 would open up a likely test to 110.85, the November low after the market retraced fro m114.73. A break below 110.85 would materially change the tone of the bullish view that has occupied the narrative so far in 2018.
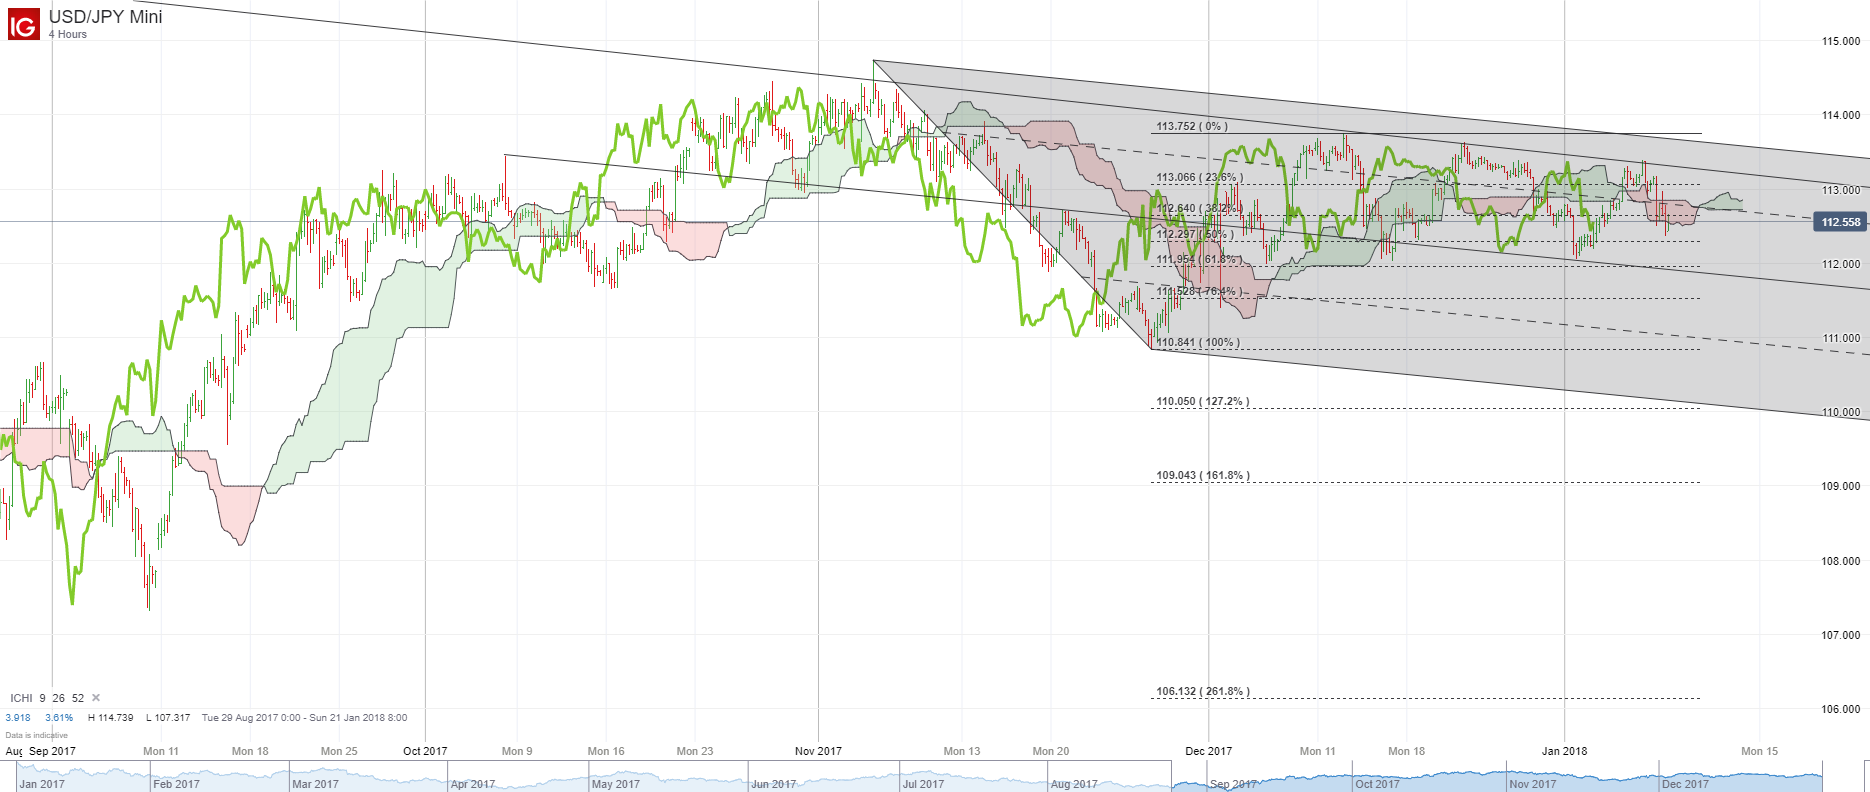
Chart created by Tyler Yell, CMT. Tweet @ForexYell for comments, questions
USD/JPY Insight from IG UK Client Positioning
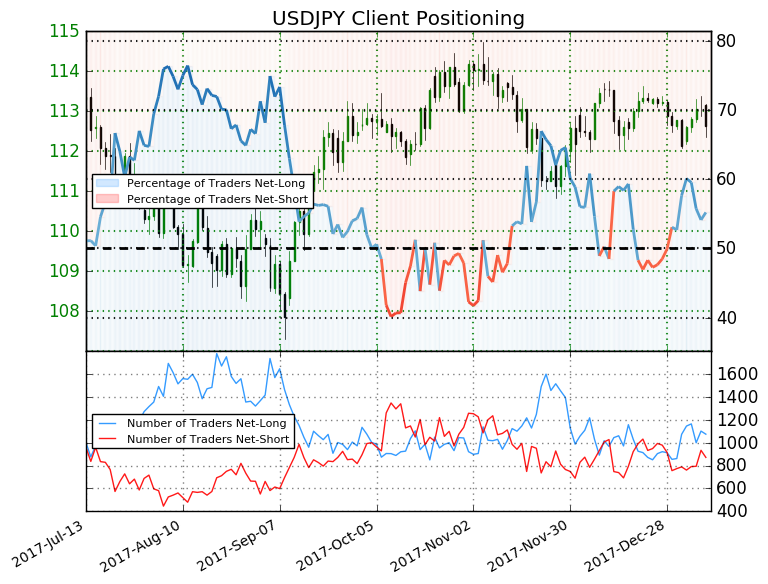
We typically take a contrarian view to crowd sentiment, and the fact traders are net-long suggests USDJPY prices may continue to fall. Traders are less net-long than yesterday and compared with last week. Recent changes in sentiment warn that the current USDJPY price trend may soon reverse higher despite the fact traders remain net-long.
---
Written by Tyler Yell, CMT, Currency Analyst & Trading Instructor for DailyFX.com
To receive Tyler's analysis directly via email, please SIGN UP HERE
Contact and discuss markets with Tyler on Twitter: @ForexYell


