


Want our fresh USD/JPY outlook for Q3? Access our free forecasts by clicking here.
Highlights:
- USD/JPY technical strategy: flat, watching DXY to see if a downturn is dollar driven
- USD/JPY Bearish reversal likely to put pressure on prior resistance/ 38.2% Fibo
- Strengthening yield correlation of USD/JPY puts focus on Yellen testimony/ CPI
- IGCS shows the USD/JPY tide may soon be turning
USD/JPY has seen an abrupt change of course in the last 24 hours of trading. After a month long hike from 108.8 to 114.49 on Wednesday, we’ve seen a sharp turnaround. The price pattern looks like an evening start reversal, but there are few things to note. First, the USD and JPY are the two weakest currencies in G8 on a relative measure (240-minute chart against a 200-MA). Second, the correlation to JPY and yields has pushed higher (meaning stronger) to recent positive extremes when looking over the last decade. Third and last, the Fed appears to be pulling back from their hawkishness as other central banks are pushing forward and Friday’s CPI could be crucial in the upcoming trend for US yields. A miss in the CPI print on Friday, and we may see a chipping away of the pricing in for a Q4 hike, which would likely take USD/JPY lower.
Watch the US CPI print number as it is announced by clicking here
While some may look at a stronger JPY (lower USD/JPY) as a sign that we’re in the risk-off mood, it’s worth noting that as two weak currencies, the directional pulls of this pair should not be applied to the overall market. Given the strength of the Canadian Dollar, Australian Dollar, or Euro, it may be more appropriate to watch CAD/JPY or EUR/JPY before casting judgment that the market is shifting to risk-off mode.
Recommended reading: AUD/JPY may be another JPY pair to approach YTD highs
The chart below shows that the pullback earlier this week happened near the May and March high. Prior peaks are excellent zones for resistance, and only a strong trend with momentum can be expected to breakthrough. A miss on Friday’s US CPI could set up a strong retracemSent of the recent +5.2% move to the Fibonacci retracement zone of 112.32-110.98.
We have recently seen the Bank of Japan adjust their focus of their Yield Curve Control arm of their QQE. Therefore, when the dust settles, it is fair to assume that USD/JPY, and other JPY crosses will arise as a Fed that continues to hike will still eventually push up yields despite the short-term noise. A break and a weekly close below 110 would cause this view to be reviewed.
Join Tyler in his Daily Closing Bell webinars at 3 pm ET to discuss market developments.
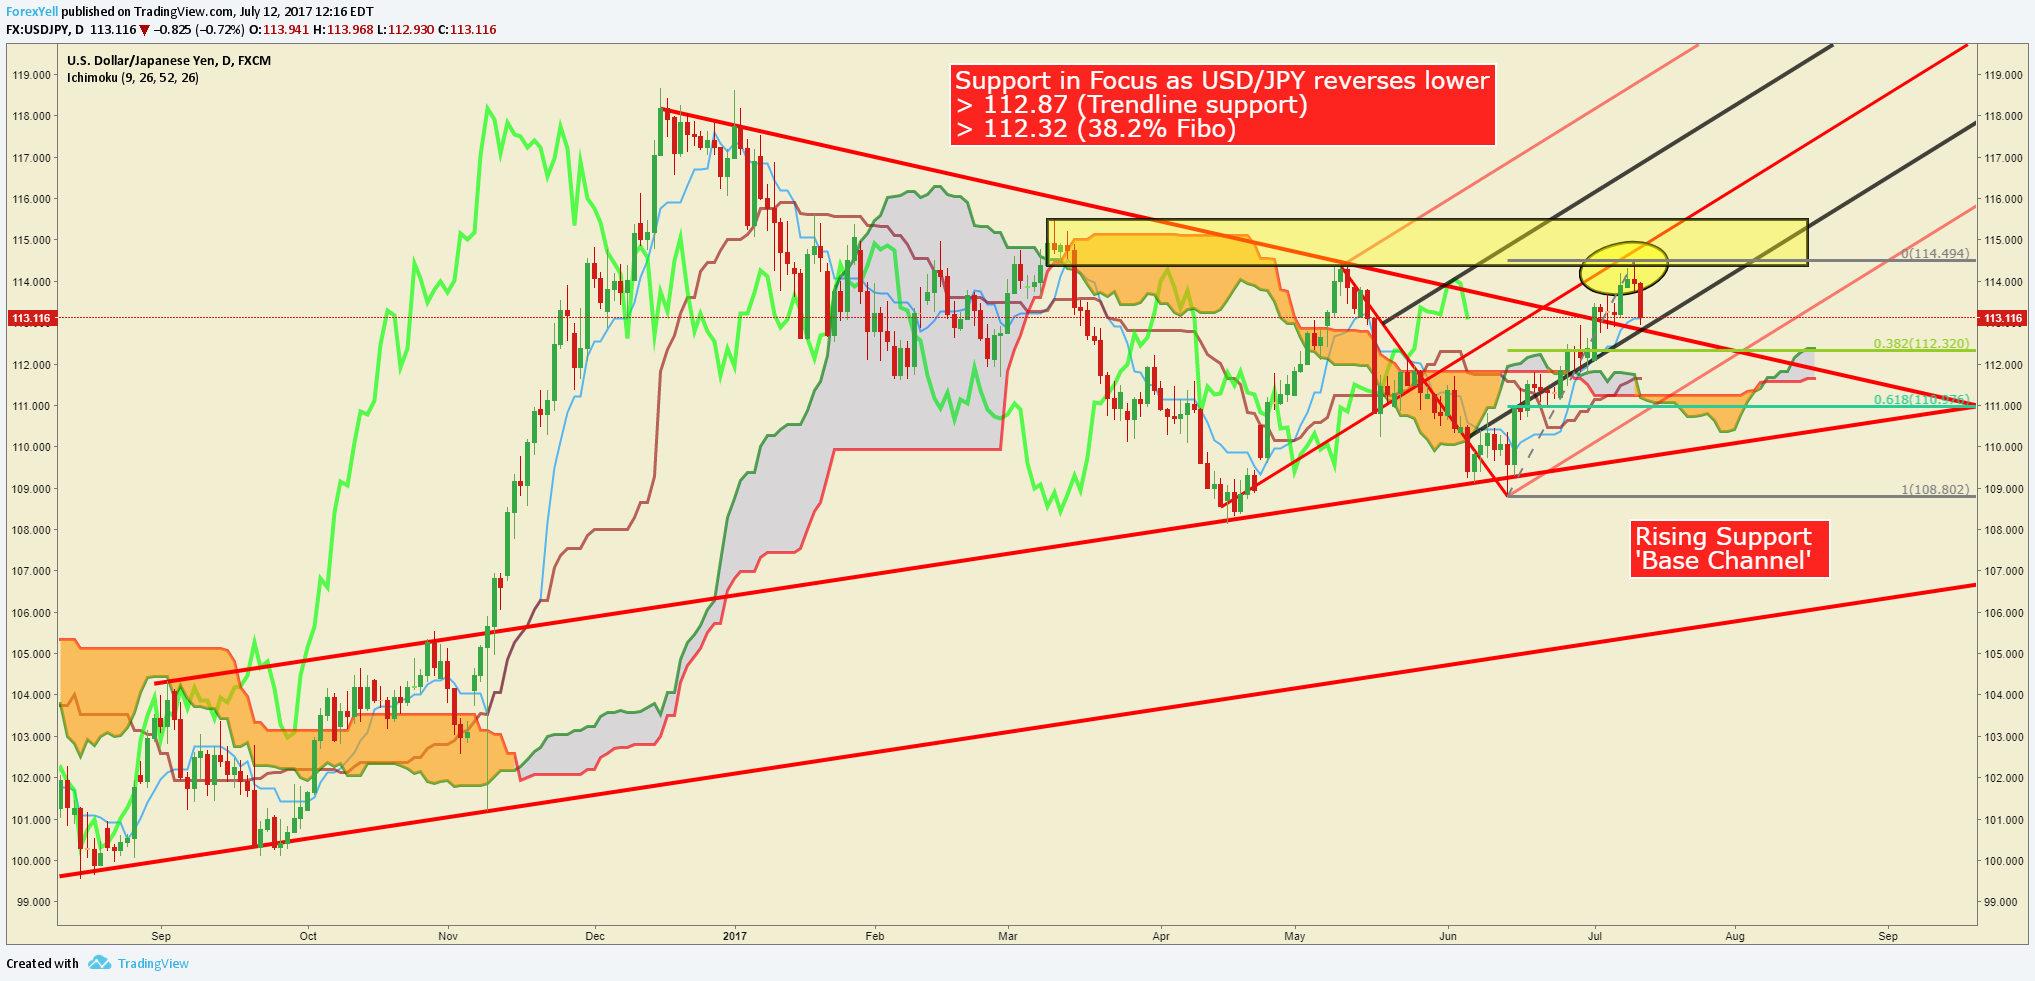
Chart Created by Tyler Yell, CMT
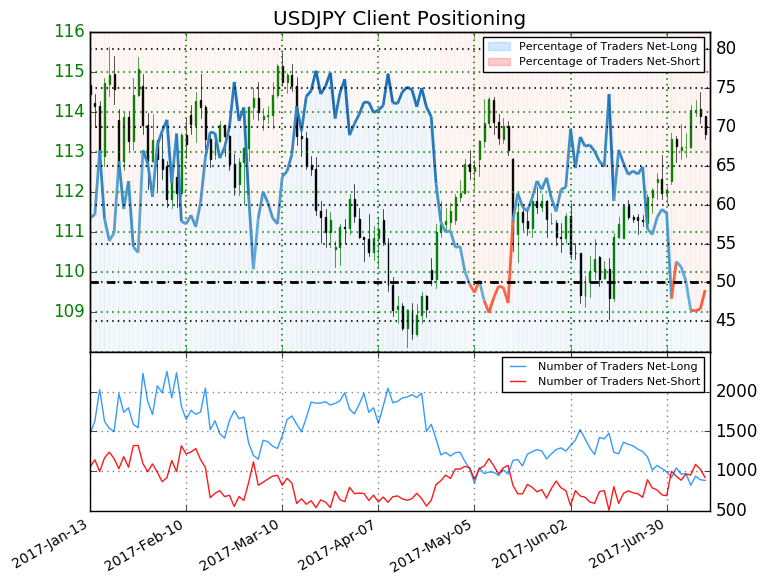
USD/JPY IG Trader Sentiment:The USD/JPY tide may soon be turning
What do retail traders’ buy/sell decisions hint about the JPY trend? Find out here !
USDJPY: Retail trader data shows 49.0% of traders are net-long with the ratio of traders short to long at 1.04 to 1. The number of traders net-long is 13.0% lower than yesterday and 21.1% lower from last week, while the number of traders net-short is 14.5% lower than yesterday and 6.5% lower from last week.
We typically take a contrarian view to crowd sentiment, and the fact traders are net-short suggests USDJPY prices may continue to rise. Positioning is less net-short than yesterday but more net-short from last week. The combination of current sentiment and recent changes gives us a further mixed USDJPY trading bias.. (Emphasis Mine)
---
Written by Tyler Yell, CMT, Currency Analyst & Trading Instructor for DailyFX.com
To receive Tyler's analysis directly via email, please SIGN UP HERE
Contact and discuss markets with Tyler on Twitter: @ForexYell


