Talking Points:
- USJ/JPY Technical Strategy: Strong Resistance Is Now An Atr (5)-Away
- 200-Week Moving Average Remains The Line In The Sand (106.42)
- For Now, Traders Are Curious Whether The BoJ Will Deliver A Weaker JPY
Access Our Free Q3 JPY Outlook As Pressures Mount on BoJ & the Federal Reserve Here
The BoJ is Fighting With Threats
As of Tuesday, USD/JPY looks ready to test and possibly break historically significant support in the ~101 zone. Over the last 17 years, we’ve seen pivots in this zone. However, we’re as uncertain as ever whether or not a base is forming, or more downside is likely.
Haven flows have ruled the start of a shortened week that will see NFP on Friday. Both JPY and the US Dollar traded higher as a benefactor of haven capital flows sent the German 10-yr Bund to record lows of -0.172% alongside the US 10-Yr Treasury that traded with a record-low yield of 1.36%.
The concern at present is that the tipping point of this move toward a stronger JPY aligned with the Bank of Japan announcement of negative interest rates. That was seen as a “Hail-Mary” of sorts to weaken the JPY be engaging in such a dramatic policy shift that would have large and uncertain implications.
As of July 5, the JPY has strengthened by up ~19% since the negative interest rate announcement came on January 29.
Given the post-negative interest rate announcement JPY strength on such a dovish policy announcement, few are expecting support at ~101 to hold.
Find The Habits That Emerged From Successful Traders When We Studied 10’s of Millions Real Trades
USD/JPY Continues To Knife Through Key Support On Unrelenting JPY Strength

Looking above, you can see what appears to be a very clear downtrend alongside a 200-WMA (currently at 106.55). The chart above does not show the long-term significance of the 200-WMA, but the break below favors further downside and the 200-WMA should be treated as significant resistance. Additionally, the 55-DMA is in the same neighborhood at ~106.35.
The last time the price of USD/JPY broke below the 200-Week Moving Average was in 2008 at the ~113 level where the price would eventually fall to 75.55 for a ~33% drop. Subsequently, USD/JPY traded above the 200-WMA at ~85 in late 2012, and the recent break was the first break since 2012.
Now, the greater fear is that we are entering not only a more volatile currency cycle but also a time of renewed JPY strength. JPY strength, which has recently abated could be at the fear that central banks will have a hard time controlling market forces given they have provided most of the stimulus they can and are now searching for less tested/ trusted means of “price stability.”
The Technical Picture
The Bearish Price Channel (Blue) is drawn from the June 2015 High, the August 24 low and the November high. This channel has contained the price rather well, and until there is a break above that channel median-line (106.32), it is difficult to say with a straight face that the Bull market may soon resume. Though recent rumors of a ~$100B stimulus are giving bulls hope that the USD/JPY bottom is set at ¥98.77.
Shorter-term resistance will be at the Thursday’s high of 105.92. The 106 level is significant resistance as well because it aligns with the Brexit day’s high of 106.80 and the other significant moving averages mentioned above.
When hope springs for a new uptrend, the first higher low is typically the best place to focus. That high-low and significant current support is at 99.975. Below the higher low, the Friday, June 24 low of 98.77 will be watched to see if there is any hope for JPY bears.
Below there, you can look to the 61.8% Fibonacci Retracement of the 2011-2015 range at 94.83. Given the recent volatility, a new breakdown could easily bring us to these levels. Should we break below these levels, expect to hear from the Bank of Japan.
However, USD/JPY Sentiment Shows Bears Are Jumping In

When looking at sentiment, the most pressing development is a rise in new short positions. As of Thursday, the ratio of long to short positions in the USDJPY stands at 1.32, as 57% of traders are long.
To See How Live Clients Are Positioned In FX & Equities Click Here Now
Yesterday the ratio was 1.64; 62% of open positions were long. Long positions are 10.1% lower than yesterday and 32.9% below levels seen last week. Short positions are 11.2% higher than yesterday and 106.8% above levels seen last week.
We use our SSI as a contrarian indicator to price action, and the fact that the majority of traders are long gives a signal that the USDJPY may continue lower. The trading crowd has grown less net-long from yesterday and last week. The combination of current sentiment and recent changes gives a further mixed trading bias.
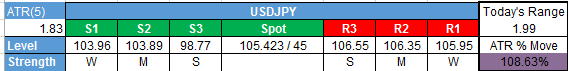
Shorter-Term USD/JPY Technical Levels: July 14, 2016
For those interested in shorter-term levels of focus than the ones above, these levels signal important potential pivot levels over the next 48-hours.