


To See How FXCM’s Live Clients Are Positioned In FX & Equities Click Here Now
Talking Points:
- USD/JPY Technical Strategy: Burden Of Proof Squarely On Bulls, Selling Rips
- Other JPY Crosses Providing More Excitement Due To Lack of Dollar Demand
- BoJ Failure Brings Sharpest Move Higher To The Delight of Hedge Funds
Unevenly Distributed Gains in JPY Weakness
Nothing was the most bullish thing the Bank of Japan could have done on Thursday, and they did exactly that. Last week, an aggressive move off key support on rumors that the BoJ would bring negative interest rate loans as the next component of Abenomics. When a new form of easing failed to materialize, JPY bears capitulated by exiting their position and pushing some JPY crosses lower by ~4-5% over the last five days as we’ve see in the United States & Australian Dollar.
The reason given for the BoJ to hold off on new forms of easing was to wait and see how the January 29 announcement was impacting markets. Given the rather dovish Federal Reserve rate announcement on Wednesday, the JPY jumped by the most since 2010. Additionally, the Bank of Japan also appears to no longer be interested in meeting market demands, which is usually more easing, and more interested in a wait-and-see approach that could lead to more JPY strength throughout the summer.
Happy Hedge Funds:
Recently, we noted that the Commitment of Traders Index released by the CFTC shows speculators in large institutions are heavily biased in the direction of lower USD via DXY and long JPY futures or bearish USD/JPY.
In both the US Dollar & JPY the COT Index, which is the difference between net speculative positioning and net commercial positioning measured is at its largest in over a year. The argument made by the CoT Index is that speculators for institutions are pushing the US Dollar lower & JPY higher or USD/JPY down.
Now The 108 Failed to Hold, We Could Be Heading Toward 106.30-105.18:
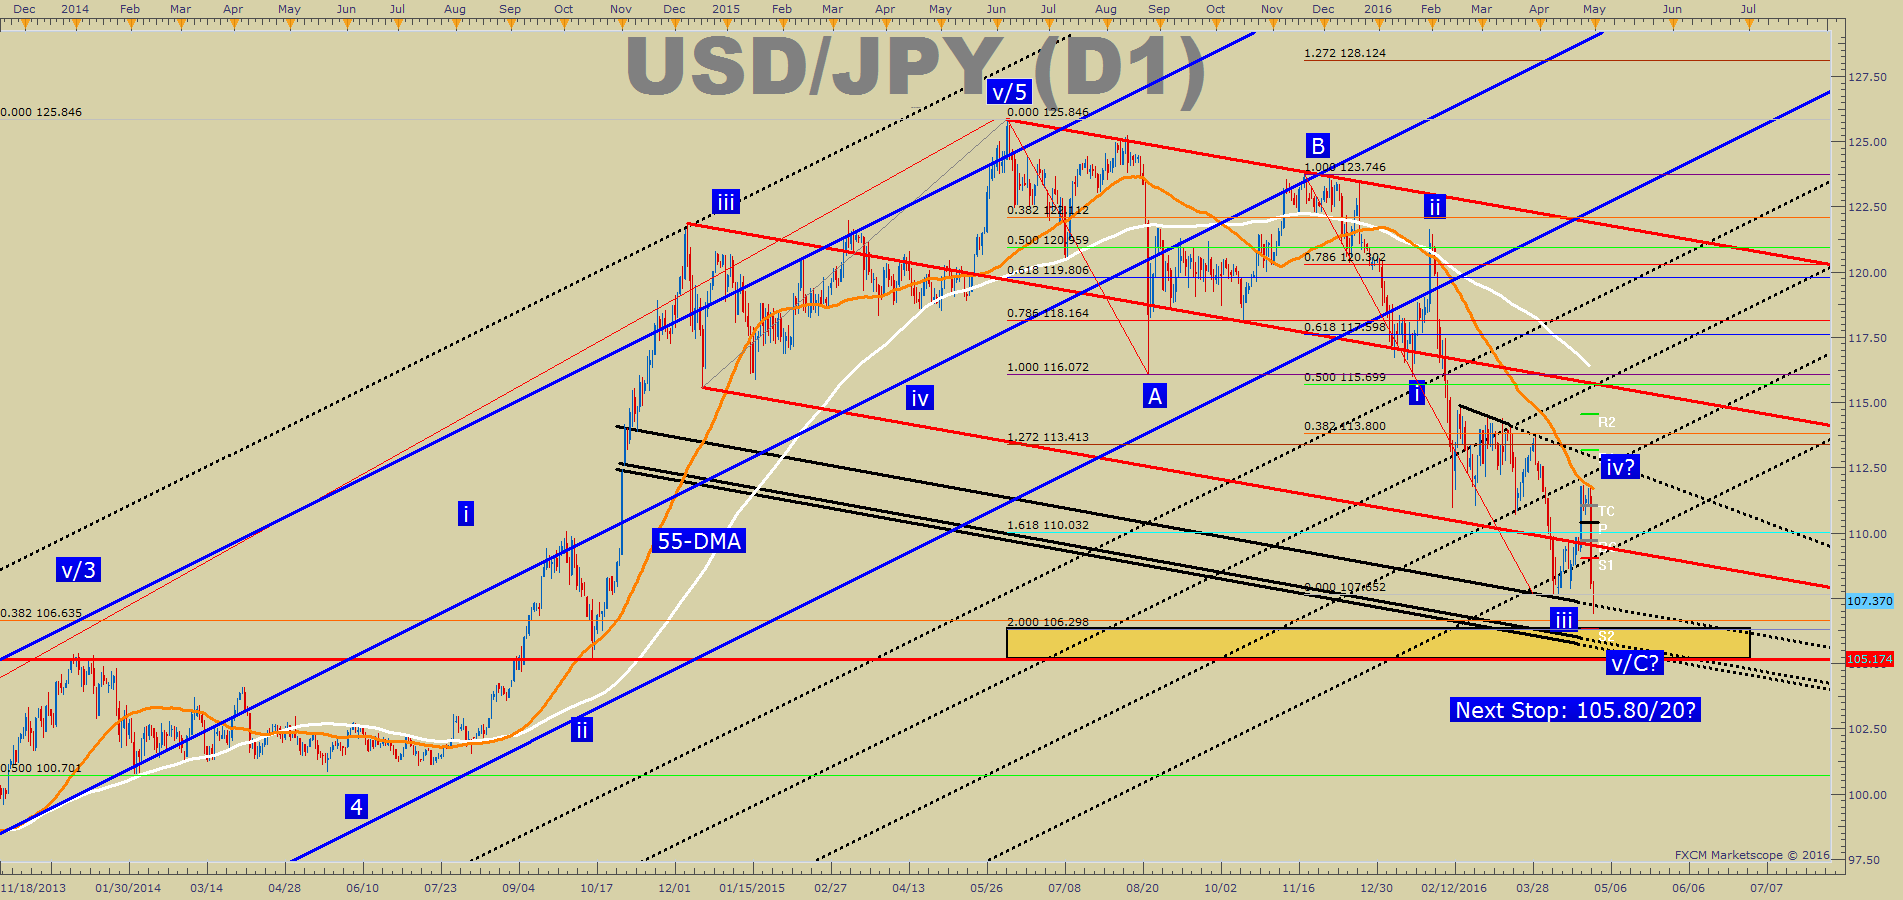
Key Technical Levels:
The chart above zones in on the chart we showed you on Wednesday’s post where we discussed the importances of the 55-DMA. Earlier this week, the 55-DMA, which is sitting around 111.80, acted as ideal resistance on the move from 107.93 to 111.87 before pushing aggressively lower to touch new 18-month lows.
Therefore, strong trend-defining resistance is very clear at the 55-DMA. Traders who understandably want more confirmation can wait for a break above the Ichimoku cloud to signal a trend change may be under way. Support becomes a bit more tricky when looking at 18-month lows, but we’re not without a few good targets.
First, the Bearish Head & Shoulder’s target for a full move, 100% of the neckline to pattern apex sits around 106.30. As of Friday morning, USD/JPY is sitting ~100 pips away from that target. Beyond the long-term Bearish Head & Shoulder’s target lies the October 15, 2014, low. This level is marked on the chart above and is at 105.18. A breakdown below this level, once thought impossible would turn focus to the big 100 figure and the Hedge Funds would be in a state of sheer jubilation.
USD/JPY Sentiment Should Be on Watch As Longs Back Off Fighting The Trend

As of mid-day Friday, the ratio of long to short positions in the USDJPY stands at 2.78 as 74% of traders are long. Yesterday the ratio was 1.98; 66% of open positions were long. Long positions are 6.5% higher than yesterday and 31.8% above levels seen last week. Short positions are 10.0% higher than yesterday and 26.1% below levels seen last week. We use our SSI as a contrarian indicator to price action, and the fact that the majority of traders are long gives a signal that the USDJPY may continue lower.
Shorter-Term USD/JPY Technical Levels
For those interested in shorter-term levels of focus than the ones above, these levels signal important potential pivot levels over the next 48-hours.


