


Talking Points:
-US Dollar Technical Strategy: Short Bias Favored Below 11,918
-21-DMA Continues To Act As Firm Resistance on Move Lower
-Macro Environment Shifting To a Dollar Negative Story
Out of the G10, the US Dollar remains the weakest currency. The weakness is relative and is based on the current positioning of individual currencies against other G10 pairs on a four-hour chart against a 200-Period Moving Average. One thing the weakness does favor is not buying the US Dollar because across the board, it is weak and continues to get weaker.

As you can see above, the strong/ weak trade as of April 18 is buying AUD/USD. While this is not a trade recommendation, it is along the lines of favoring trend continuation as bullish momentum begets bullish momentum and bearish momentum begets bearish momentum. From a Technical Analysis perspective, the US Dollar continues to fall through support and is currently sitting above thin, albeit important support of last week’s low of 11,809.
Key Levels From Here

On the chart above, where you can see the 2016 high at the top left, the US Dollar appears wholly unable to hold a bid or gain bullish momentum on a temporal bounce. Given that US Dollar is lowest on the totem poll of G10 relative strength, it is appropriate to keep an eye on resistance breaking before considering hitting the bid.
Regardingappropriate Technical Resistance;last week’s high (identified with a Daily Up-Fractal) and the 21-DMA are currently around are 11,908/18. Until we get a break above this area, the weakest US Dollar will continue to favor the downside. This environment favors selling moves into resistance as it has since late-February.
Longer-Term US Dollar Chart Going Back to Early 2015
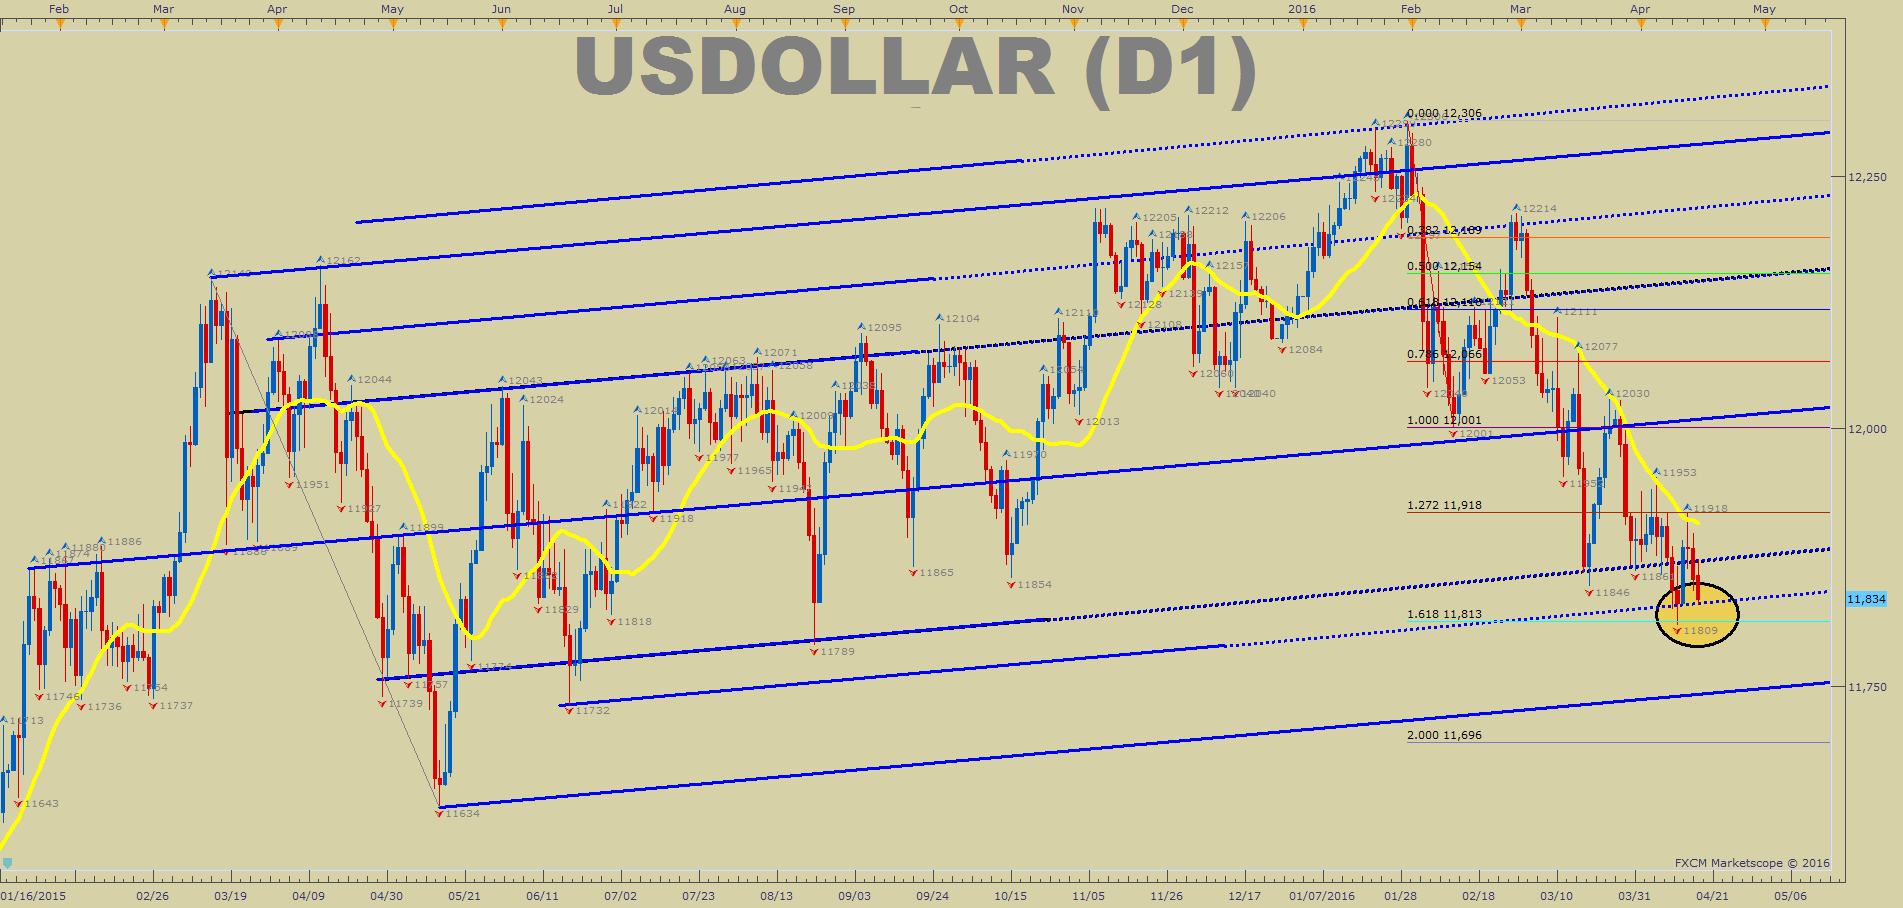
Worth noting on the chart above is that the recent support, around 11,809/13 aligns with a sliding parallel and the 61.8% extension of the original downmove that took place over the first half of February. A 61.8% extension beyond the first corrective move extreme can be a favorable target or pivot. Also, if price turns higher off that level and subsequently breaks above the levels mentioned above, 11,918/08, we could be seeing one of the first favorable US Dollar long environment since late February, which eventually went the way of the Dollar Bears. Absent those events, buying the US Dollar remains a risky move per Technical Analysis.
Shorter-Term US Dollar Technical Levels
For those interested in shorter-term levels of focus than the ones above, these levels signal important potential pivot levels over the next 48-hours.

Interested In our Analyst’s Longer-Term Dollar Outlook? Please sign up for our free dollar guide here.
T.Y.


