To receive Tyler’s analysis directly via email, please SIGN UP HERE
Talking Points:
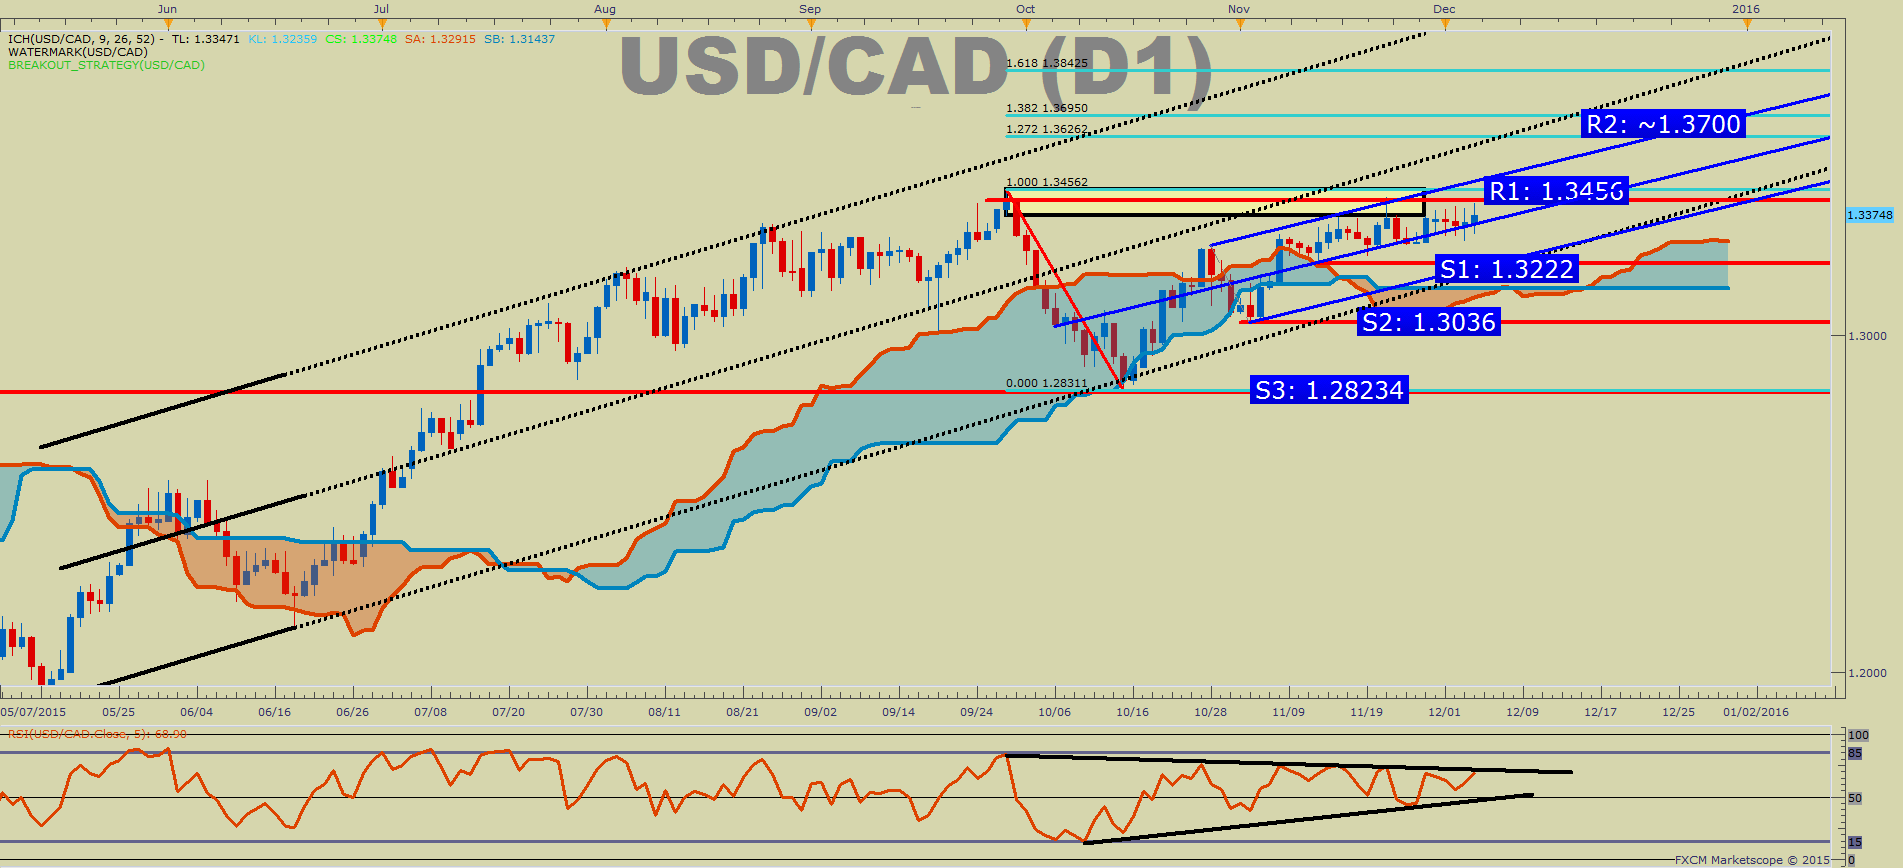
- USD/CAD Technical Strategy: Waiting For Push Through or Away From 1.3456
- Trader Sentiment Favors Breakout, But Momentum Disagrees
-Ichimoku Cloud Provides Good Support to be Patient on Breakdown
The Canadian Dollar fell against most counterparts of the G10 save the Japanese Yen. However, the irony is that the weak Canadian Dollar isn’t weaker given today’s disappointment employment report compared to its southern neighbor’s employment beat. Canadian employment saw a drop of 37k jobs vs. expectations of only a 10k loss. Every day this week, the USD/CAD has printed Doji’s. Doji’s are a candlestick formation that is nearly all wick with the open and close tightly compressed toward the middle of the candle and communicates indecision in the market. What speaks volumes is that the doji’s or indecision candles are forming near the YTD high of 1.3456 signaling that buyers may not be willing to bid USD/CAD higher. In a more simplistic tone, this could be the makings of a double-top.
Trader sentiment via SSI is currently showing there are only 27% of traders that are long. Because we use our SSI as a contrarian indicator to price action, and the fact that the majority of traders are short gives a signal that the USDCAD may continue higher. The trading crowd has grown further net-short from yesterday and last week. The combination of current sentiment and recent changes gives a further bullish trading bias. However, it’s hard to be long until we get confirmation of a break higher, and that would happen on a daily close above the YTD high of 1.3456. We’ve attempted to break that level many times but have now failed on multiple days since the middle of November. If the market wakes up, and USD/CAD goes bid, there is a series of Fibonacci Resistance levels around 1.3625/1.3700 and that would likely be the first target after piercing into new 2015 highs.
Patience, among other being well capitalized, is a virtue and common trait of successful traders. Traders wanting to enter the trade now have the most uncertain path, but would be able to get the best risk: reward on their trade should the breakout or breakdown happen as expected. For now, the preference would be to wait for a daily close below the Ichimoku cloud that aligns with the price support zone of 1.3222/1.3036. A daily break below this zone would convince many of a double-top that would have a neckline of 1.2831 followed by targets of 1.2445, the 61.8% Fibonacci Extension of the 1.2831-1.3456 zone and 1.22060, which is the 100% Fibonacci Extension of the same zone and the most common double-top target. Should a double top develop, it would likely be accompanied by an aggressive drop in the US Dollar, which recently took a hit, as well as surprising strength in the highly correlated US Oil market. Both events happening together of lower US Dollar and Oil seem like a lower probability event, but should they happen in tandem, USD/CAD could be well on its way lower to the targets mentioned above.