To receive Tyler’s analysis directly via email, please SIGN UP HERE
Talking Points:
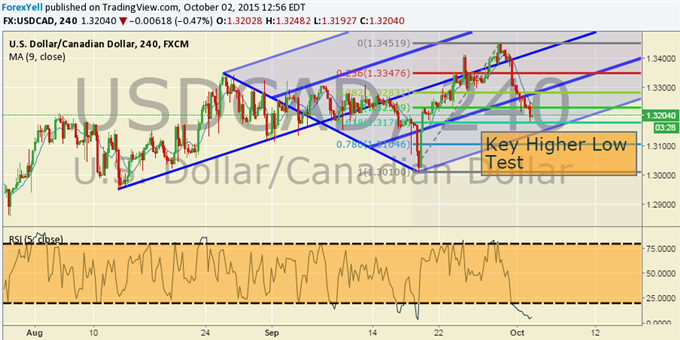
- USD/CAD Technical Strategy: Testing The Higher-Low Progressions at 1.3012
- 1.3168 Is 61.8% Fibonacci Retracement Of 1.3012-1.3457 Range
- USD/CAD Drops Just Shy Of 300 Pip From Highs This Week Of 1.3457
After printing at 11 year low, USDCAD is about to take out last week's low signaling a turnaround in the Loonie. In fact, a close below 1.3175 would set-up a bearish key week reversal, an ominous ending pattern on weekly candles. This incredibly strong trend looks to be wobbling and could retest recent support of 1.30 and 1.2950 on a confirmed. Many traders been excited about this because of oil'sdemise, but a break of those key levels will call into question the structural integrity of the uptrend and likely attract more sellers.
The exact level of focus is 1.3012, the September low and recent low we saw that respected the 1.2950 previous low. The 1.2950 low came at multiple technical confluence points showing that the bounce respected the larger trend. Considering the follow through move off 1.2950 gave us 11-year highs it’s easy to see this as key resistance. We’re working on our 3rd lower day, which we have seen since the end of August. Focus now will be on 1.2950 where a break would significantly damage the immediate view higher.
Given the larger US dollar view, a bounce around these levels followed by a break of short-term resistance would help validate the bullish continuation view. If we see a break and close below 1.2950 would open the door to start focusing on selling short term strength and looking for a deeper retracement. SSI shows that long positions have grown 46% over the last week, which may be an indication that a turn is coming as this number is aggressive. Lastly, the correlation of USOil and USDCAD continue to be inverse and worth focusing on. A break below $43.19 per barrel on US Oil would likely validate the push higher and USDCAD whereas a break above $49.49 would favor the contrarian view that a sustained push lower is upon us.
Add these technical levels directly to your charts with our Support/Resistance Wizard app!