To receive Tyler’s analysis directly via email, please SIGN UP HERE
Talking Points:
- Crude Oil Technical Strategy: Looking to get Short
- WTI / Crude Oil Showing Overbought Readings on Lower High
- Close Below Support Of $43.20 Opens Preference To Short On Presumed Retest Of $38
All eyes are on demand and the USDollar. A collapse in demand as demonstrated from manufacturing data out of emerging markets shows a dis-connect at present. In short, we’ve had aggressive supply brought onto the market at a time when demand is waning aggressively. This appears to be playing out in lower prices for longer than anticipated, which turns our attention to the USD. The USD is inversely correlated to most commodities most of the time and US Oil is no exception. If the USDollar is able to break through the nearly 7-month resistance in the 12,064-12,149 region, then lower prices below the 2015 could soon print.
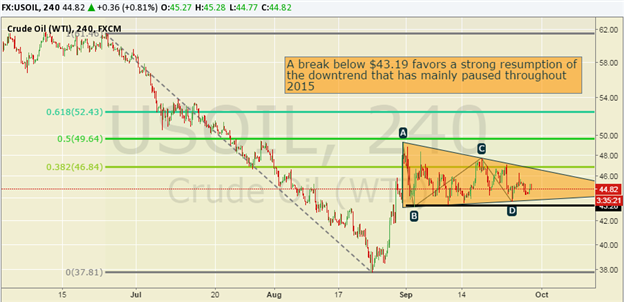
The technical outlook for crude oil is highly dependent on the technical level of $43.20 holding. An elongated triangle seems to be near its end, which classic technical analysis would favor trend continuation to the downside. Currently, resistance stands at 47.68 followed by the zone of longer-term resistance of the August 31st high of $49.49. If price is able to break and close above this upper resistance level
Short-term traders may prefer a sell signs of strength with a protective stop at resistance, which presently sits at $46.30, the September 25th high. However, a larger break higher in USD and close below $43.20 in Oil would turn our focus back toward new 6-year lows in a hurry. This would likely be a larger risk-off scenario.
Add these technical levels directly to your charts with our Support/Resistance Wizard app!