USD Technical Outlook
- DXY working on snapping a familiar price pattern
- Big test lies ahead on further strength from here


US Dollar Technical Outlook: DXY Undergoing Change in Behavior
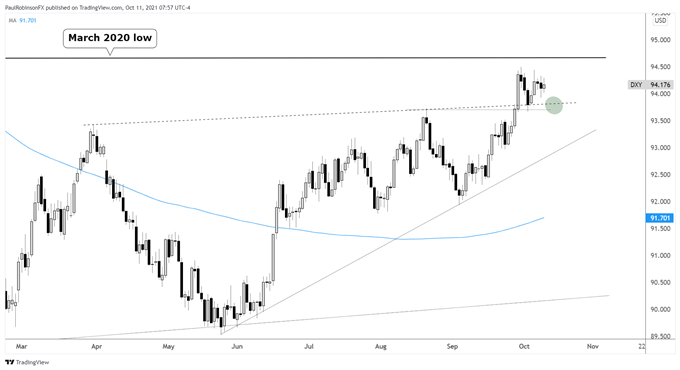
This is how I began last week’s USD commentary: The US Dollar Index (DXY) is following a familiar pattern we’ve seen on a few occasions this year – strong rallies that look sustainable but then reverse lower. This pattern appears to be snapping as the support created following the breakout is holding.
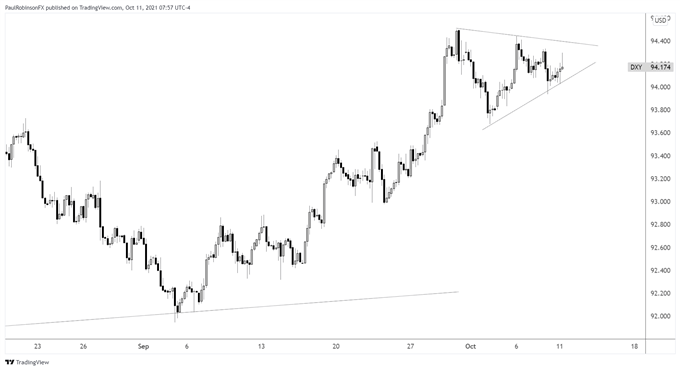
The thinking was that for would-be longs, traders should trust support until broken and look it as a possible entry for a trend continuation higher. So far this is looking like a decent setup for the long-side, with the outlook becoming further bolstered by the development of a wedge pattern.
With the wedge formation (best seen on the 4-hr chart) forming just above support and in-line with a clear trend, we should see it break to the upside. It may need a day or two more to fully develop, but if this scenario is to work out then higher levels should come soon.
Another leg up will bring into play an important area of resistance via the March 2020 low that was later validated as resistance in September of last year. The area right around 94.67 could be a difficult one to get through on a first attempt.
But if we are indeed going to see the USD build significantly on its bullish trend then it may only be a minor roadblock. As per usual, watching price action closely will be the key. Volatility or a strong reversal around resistance will dent the bullish outlook, while a clean break through will increase it.
To turn the outlook neutral to negative, the DXY will need to break below 93.67. This action would make for a lower-low below the confluent support that we are currently see act as a backstop.


US Dollar Index (DXY) Daily Chart

US Dollar Index (DXY) 4-hr Chart

Resources for Forex Traders
Whether you are a new or experienced trader, we have several resources available to help you; indicator for tracking trader sentiment, quarterly trading forecasts, analytical and educational webinars held daily, trading guides to help you improve trading performance, and one specifically for those who are new to forex.
---Written by Paul Robinson, Market Analyst
You can follow Paul on Twitter at @PaulRobinsonFX


