


US Dollar Technical Price Outlook: DXY Weekly Trade Levels
- US Dollar technical trade level update – Daily & Intraday Charts
- USD snaps two-week winning streak – monthly range is preserved
- DXY bears vulnerable while above 92.28- bearish invalidation steady at 94.65
The US Dollar is off more than 0.35% this week with the DXY snapping a two-week winning streak after rebounding off long-term trend support. While the broader outlook remains weighted to the downside, the risk remains for a near-term recovery in the greenback as the index responds to long-term uptrend support. These are the updated technical targets and invalidation levels that matter on the US Dollar Index weekly price chart. Review my latest Strategy Webinar for an in-depth breakdown of this DXY technical setup and more.
US Dollar Index Price Chart – DXY Weekly

Chart Prepared by Michael Boutros, Technical Strategist; US Dollar Index on Tradingview
Notes: In last month’s US Dollar Weekly Price Outlook we noted that the DXY sell-off was, “testing slope support at fresh multi-year lows and while the risk remains weighted to the downside, the immediate decline may be vulnerable here.” The level in focus was the 2018 yearly open at 92.28- this threshold held on a close basis with the index registering an intra-week low at 91.75 into the start of September. A rally of more than 2% off the lows failed last week with the index trading into the mid-month range heading into the close of the week.
Initial weekly resistance stands at the 61.8% Fibonacci retracement off the 2018 advance / 2016 low-week close at 93.88/92 with a breach above the March lows at 94.65 needed to suggest a larger recovery is underway. Initial support steady at 92.28 backed by the 2016 swing low at 91.92- ultimately a break / close below the 2017 low-week close / 78.6% retracement at 91.33/40 is needed to mark resumption of the broader downtrend with such a scenario risking accelerated losses for the greenback towards the 2018 lows.
For a complete breakdown of Michael’s trading strategy, review his Foundations of Technical Analysis series on Building a Trading Strategy
Bottom line: The US Dollar has responded to long-term technical support but keeps the index within the confines of the September opening-range. From a trading standpoint look for downside exhaustion ahead of 92.28 IF price is heading higher with a close above 94.65 needed to fuel a larger recovery. Ultimately, a larger recovery may offer more favorable opportunities closer to slope resistance within then yearly US Dollar downtrend.

Key US Data Releases
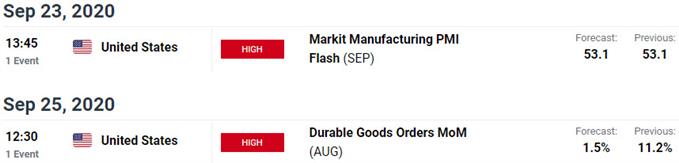
Economic Calendar - latest economic developments and upcoming event risk.
Previous Weekly Technical Charts
- Euro (EUR/USD)
- Canadian Dollar (USD/CAD)
- Gold (XAU/USD)
- Japanese Yen (USD/JPY)
- New Zealand Dollar (NZD/USD)
- Australian Dollar (AUD/USD)
- British Pound (GBP/USD)

--- Written by Michael Boutros, Technical Strategist with DailyFX
Follow Michael on Twitter @MBForex


