


US Dollar Index (DXY) Key Points:
- The ONE Thing: The longest institutional position in US Dollar in a year may face a series of crosswinds that could ultimately derail the trend. It’s likely too early to call the bullish trend in US Dollar Index that began in February over, but it is fair to say the technical developments across global assets should have USD bulls warry of remaining as confident as they were a week ago.
- For the Dollar to move significantly (>2%) lower, we’d likely need to see a large unwind of the massive Treasury short trade. One key tenor in focus is the 5-year UST Yield, and a significant move below 2.7% could be the trigger that causes weak shorts to head for the exits, which lead to USD weakness.
- A four-month trend that Head Trading Instructor, Jeremy Wagner, CEWA-M has been riding of short EUR/USD (a long US Dollar trade) was kicked out this morning on a retreat in the US Dollar.
- Technical Outlook on the US Dollar: Ichimoku can help traders gauge broader moves in the market since it focuses on multiple-time frames of trend and momentum.
Will US Dollar Bulls Defy Donald Trump?
Friday’s CFTC Report had a little something for everyone. Gold bears (a bullish USD play) hit a record while US Treasury short positions ( a bet on higher yields) were also at a record at just short of 700k contracts. On the other side of the market, the clear long play was US Dollar with leveraged speculators or hedge funds increasing their net longs on the US Dollar to an 18-month high as of August 14.
Positioning extremes are not, in and of themselves, a trade signal. However, squeeze conditions (where positions are tested by the opposition) is always something that traders should be anticipating.
Enter Donald Trump, and his latest comments where he was “disappointed” in his nominee for the Fed chair, Jerome Powell for not being easy money enough as well as taking a stab at EU & China as currency manipulators. Traders should also be aware of the steps that China has taken to support the Renminbi and can see more information on this analyst pick, Despite the Ongoing Global Trade War, USD/CNH May Have Topped.
Hedge Funds Push DXY Longs By Most In 18-Months Ahead of Trump's Comments
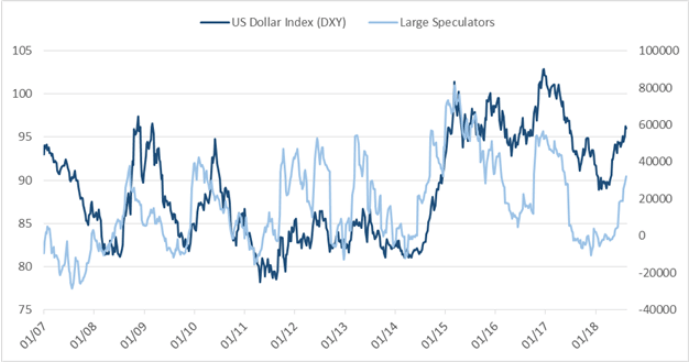
Source: CoT Update: Large Speculators Net-short Gold First Time in a Long Time
The last time that Trump talked down the US Dollar, the advancement stopped before muddling along for weeks before kicking by higher again thanks in part to a broad USD/CNH rally that had kick-started again.
Given the extreme positioning, a pullback in DXY longs could lead to a pullback toward key support that is seen best on the US Dollar price chart.
Unlock our Q3 forecast to learn what will drive trends for the US Dollar through the rest of2018!
Technically Speaking – US Dollar Meets Slope Resistance

Chart Source: Pro Real Time with IG UK Price Feed. Created by Tyler Yell, CMT
The chart above shows the US Dollar’s two broad peaks going back to March 2015. Using the corrective high in December 2015 as a handle for a broad Andrew’s Pitchfork, following by the 2016 low and 2017 high, you can see that we’re approaching slope resistance.
While visually appealing, trading by slope tends to be a bit more art than science, and the tell of a good pitchfork is whether or not the market reacts to slope pivots. An internal trendline/ slope may have given a cue that USD weakness could become a short-term theme and for clarification on that, we’ll turn to Ichimoku.
Ichimoku is a multi-timeframe trend and momentum indicator that combines five lines to attempt to give you a full picture. I combine the CCI(26) to see if the short-term trend is ending as evidenced by price breaking below the 26-day midpoint, which it did on Tuesday. Since April, a move to the 26-period midpoint has been a buying opportunity, so proceed with caution.
For caution visualized, I use the lagging line (bright green), which would need to see the price break below 93.85 before an argument could be made that we’re now seeing a broader pull back in USD that could ignited and verified by a persistent pullback in DXY Commitment of Traders positioning for USD.
A bearish break in the lagging line would also have the price below the cloud on the daily chart for the first time since April, and would likely be verified through a strengthening Chinese Yuan, EUR, & Gold price.
Traders should note that 93.85 is near the 38.2% retracement of the 2018 range, and would make for a nice pull-back terminus though a sharp move lower like a hot knife through butter could open up the door for a move to the 61.8% retracement of the same range at 91.24.
We’ll see.
New to FX trading? No worries, we created this guide just for you.
More from DailyFX to Support Your Trading
Are you looking for longer-term analysis on the U.S. Dollar? Our DailyFX Forecasts for Q3 have a section for each major currency, and we also offer an excess of resources on USD-pairs such as EUR/USD, GBP/USD, USD/JPY, AUD/USD. Traders can also stay up with near-term positioning via our popular and free IG Client Sentiment Indicator.
---Written by Tyler Yell, CMT
Tyler Yell is a Chartered Market Technician. Tyler provides Technical analysis that is powered by fundamental factors on key markets as well as t1rading educational resources. Read more of Tyler’s Technical reports via his bio page.
Communicate with Tyler and have your shout below by posting in the comments area. Feel free to include your market views as well.
Discuss this market with Tyler in the live webinar, FX Closing Bell, Weekdays Monday-Thursday at 3 pm ET.
Talk markets on twitter @ForexYell


