FTSE 100 Technical Highlights:
- FTSE slammed, head-and-shoulders top cleaning up nicely
- Still some support below, but not might not matter
For our analysts intermediate-term fundamental and technical view on the FTSE and other major indices, check out the Q4 Global Equity Markets Forecast.
FTSE slammed, head-and-shoulders top cleaning up nicely
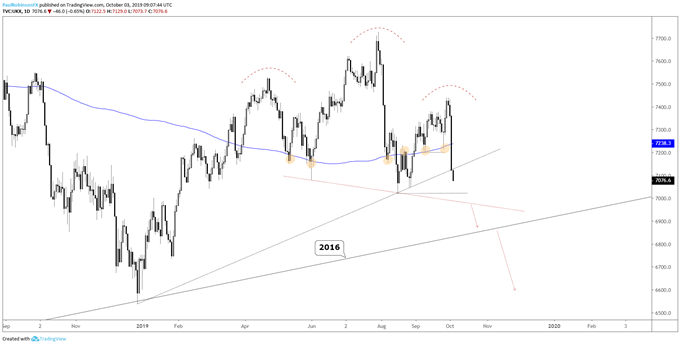
Global stocks took a sizable hit yesterday, with the FTSE falling especially hard. The decline had the UK benchmark slicing through the 200-day MA with ease. This was support on a couple of occasions last month, but not the case this time around.
This is what I had to say last week in regard to the 200-day and potential for a top: “Now that the UK index is shooting higher off support the upside must be respected again. However, there is still plenty of room for a large top, a head-and-shoulders formation, to come to form and post a significant threat in Q4.”
The decline yesterday cemented the right shoulder and brought the head-and-shoulders (H&S) into full view. It hasn’t yet triggered, so it is important to be mindful of this and the fact that there is still support below. However, given the general landscape around the world, and more specifically in the U.S. where the important NDX index is rolling over, pressure on global equities looks here to stay.
The December trend-line is currently breaking, should it continue then the August low and neckline will be next up. A break below the neckline arrives near the February 2016 trend-line that connects that large corrective low with the bottom of the swoon ending in December. A trigger of the H&S formation and break of long-term trend support is likely to have the FTSE really rolling downhill this quarter.
For now, the short-term trading bias remains in favor of shorts. The longer-view is growing increasingly bearish and may turn the UK stock market on its head alongside the rest of the planet.
Check out this guide for 4 ideas on how to Build Confidence in Trading.
FTSE Daily Chart (H&S top coming into clear view)

UK 100 Index Charts by Tradingview
You can join me every Wednesday at 930 GMT for live analysis on equity indices and commodities, and for the remaining roster of live events, check out the webinar calendar.
Tools for Forex & CFD Traders
Whether you are a beginning or experienced trader, DailyFX has several resources available to help you; indicator for tracking trader sentiment, quarterly trading forecasts, analytical and educational webinars held daily, trading guides to help you improve trading performance, and one specifically for those who are new to forex.
---Written by Paul Robinson, Market Analyst
You can follow Paul on Twitter at @PaulRobinsonFX


